Cities with the Largest Greek Community in Illinois
RELATED REPORTS & OPTIONS
Greek
Illinois
Compare Cities
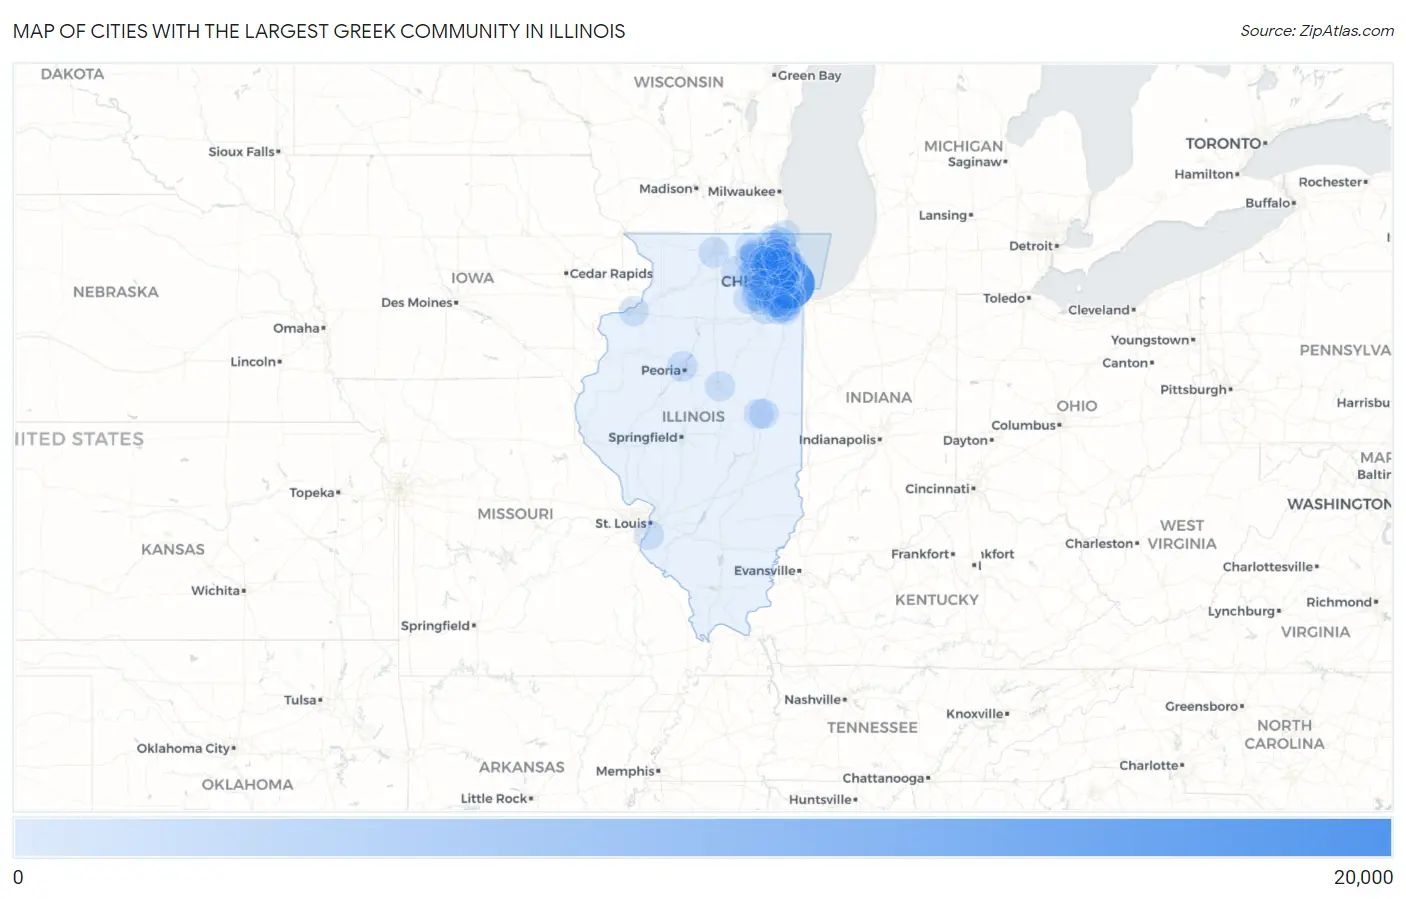
Map of Cities with the Largest Greek Community in Illinois
0
20,000
Cities with the Largest Greek Community in Illinois
| City | Greek | vs State | vs National | |
| 1. | Chicago | 16,404 | 86,493(18.97%)#1 | 1,230,319(1.33%)#2 |
| 2. | Orland Park | 1,667 | 86,493(1.93%)#2 | 1,230,319(0.14%)#39 |
| 3. | Glenview | 1,667 | 86,493(1.93%)#3 | 1,230,319(0.14%)#40 |
| 4. | Naperville | 1,517 | 86,493(1.75%)#4 | 1,230,319(0.12%)#50 |
| 5. | Mount Prospect | 1,422 | 86,493(1.64%)#5 | 1,230,319(0.12%)#54 |
| 6. | Arlington Heights | 1,371 | 86,493(1.59%)#6 | 1,230,319(0.11%)#59 |
| 7. | Des Plaines | 1,098 | 86,493(1.27%)#7 | 1,230,319(0.09%)#85 |
| 8. | Tinley Park | 1,079 | 86,493(1.25%)#8 | 1,230,319(0.09%)#86 |
| 9. | Park Ridge | 1,044 | 86,493(1.21%)#9 | 1,230,319(0.08%)#91 |
| 10. | Niles | 924 | 86,493(1.07%)#10 | 1,230,319(0.08%)#111 |
| 11. | Addison | 923 | 86,493(1.07%)#11 | 1,230,319(0.08%)#112 |
| 12. | Morton Grove | 917 | 86,493(1.06%)#12 | 1,230,319(0.07%)#113 |
| 13. | Northbrook | 770 | 86,493(0.89%)#13 | 1,230,319(0.06%)#149 |
| 14. | Joliet | 763 | 86,493(0.88%)#14 | 1,230,319(0.06%)#151 |
| 15. | Lombard | 762 | 86,493(0.88%)#15 | 1,230,319(0.06%)#153 |
| 16. | Skokie | 759 | 86,493(0.88%)#16 | 1,230,319(0.06%)#154 |
| 17. | Schaumburg | 757 | 86,493(0.88%)#17 | 1,230,319(0.06%)#156 |
| 18. | Elmhurst | 756 | 86,493(0.87%)#18 | 1,230,319(0.06%)#158 |
| 19. | Downers Grove | 735 | 86,493(0.85%)#19 | 1,230,319(0.06%)#169 |
| 20. | Aurora | 715 | 86,493(0.83%)#20 | 1,230,319(0.06%)#180 |
| 21. | Hoffman Estates | 630 | 86,493(0.73%)#21 | 1,230,319(0.05%)#213 |
| 22. | Wheaton | 619 | 86,493(0.72%)#22 | 1,230,319(0.05%)#219 |
| 23. | Carol Stream | 610 | 86,493(0.71%)#23 | 1,230,319(0.05%)#227 |
| 24. | Lincolnwood | 603 | 86,493(0.70%)#24 | 1,230,319(0.05%)#236 |
| 25. | Bensenville | 601 | 86,493(0.69%)#25 | 1,230,319(0.05%)#238 |
| 26. | New Lenox | 583 | 86,493(0.67%)#26 | 1,230,319(0.05%)#246 |
| 27. | St Charles | 575 | 86,493(0.66%)#27 | 1,230,319(0.05%)#250 |
| 28. | Peoria | 573 | 86,493(0.66%)#28 | 1,230,319(0.05%)#253 |
| 29. | Wilmette | 545 | 86,493(0.63%)#29 | 1,230,319(0.04%)#271 |
| 30. | Palatine | 540 | 86,493(0.62%)#30 | 1,230,319(0.04%)#278 |
| 31. | Oak Lawn | 530 | 86,493(0.61%)#31 | 1,230,319(0.04%)#287 |
| 32. | Woodridge | 492 | 86,493(0.57%)#32 | 1,230,319(0.04%)#314 |
| 33. | Evanston | 483 | 86,493(0.56%)#33 | 1,230,319(0.04%)#319 |
| 34. | Rolling Meadows | 483 | 86,493(0.56%)#34 | 1,230,319(0.04%)#321 |
| 35. | Palos Hills | 482 | 86,493(0.56%)#35 | 1,230,319(0.04%)#323 |
| 36. | Darien | 465 | 86,493(0.54%)#36 | 1,230,319(0.04%)#344 |
| 37. | Harwood Heights | 460 | 86,493(0.53%)#37 | 1,230,319(0.04%)#348 |
| 38. | Yorkville | 454 | 86,493(0.52%)#38 | 1,230,319(0.04%)#354 |
| 39. | Elmwood Park | 439 | 86,493(0.51%)#39 | 1,230,319(0.04%)#371 |
| 40. | Rockford | 437 | 86,493(0.51%)#40 | 1,230,319(0.04%)#374 |
| 41. | Oak Park | 417 | 86,493(0.48%)#41 | 1,230,319(0.03%)#407 |
| 42. | Libertyville | 413 | 86,493(0.48%)#42 | 1,230,319(0.03%)#415 |
| 43. | Roselle | 411 | 86,493(0.48%)#43 | 1,230,319(0.03%)#420 |
| 44. | Bolingbrook | 410 | 86,493(0.47%)#44 | 1,230,319(0.03%)#421 |
| 45. | Lindenhurst | 402 | 86,493(0.46%)#45 | 1,230,319(0.03%)#436 |
| 46. | Bloomingdale | 401 | 86,493(0.46%)#46 | 1,230,319(0.03%)#440 |
| 47. | Algonquin | 397 | 86,493(0.46%)#47 | 1,230,319(0.03%)#449 |
| 48. | Elgin | 394 | 86,493(0.46%)#48 | 1,230,319(0.03%)#451 |
| 49. | Lake Forest | 390 | 86,493(0.45%)#49 | 1,230,319(0.03%)#460 |
| 50. | Mundelein | 385 | 86,493(0.45%)#50 | 1,230,319(0.03%)#467 |
| 51. | Northfield | 377 | 86,493(0.44%)#51 | 1,230,319(0.03%)#478 |
| 52. | Huntley | 376 | 86,493(0.43%)#52 | 1,230,319(0.03%)#480 |
| 53. | Lemont | 371 | 86,493(0.43%)#53 | 1,230,319(0.03%)#486 |
| 54. | Plainfield | 365 | 86,493(0.42%)#54 | 1,230,319(0.03%)#495 |
| 55. | Hinsdale | 353 | 86,493(0.41%)#55 | 1,230,319(0.03%)#519 |
| 56. | Wheeling | 341 | 86,493(0.39%)#56 | 1,230,319(0.03%)#545 |
| 57. | Highland Park | 338 | 86,493(0.39%)#57 | 1,230,319(0.03%)#550 |
| 58. | River Forest | 332 | 86,493(0.38%)#58 | 1,230,319(0.03%)#560 |
| 59. | Berwyn | 329 | 86,493(0.38%)#59 | 1,230,319(0.03%)#571 |
| 60. | Norridge | 328 | 86,493(0.38%)#60 | 1,230,319(0.03%)#576 |
| 61. | Champaign | 324 | 86,493(0.37%)#61 | 1,230,319(0.03%)#586 |
| 62. | La Grange Park | 321 | 86,493(0.37%)#62 | 1,230,319(0.03%)#600 |
| 63. | Streamwood | 320 | 86,493(0.37%)#63 | 1,230,319(0.03%)#601 |
| 64. | Bartlett | 312 | 86,493(0.36%)#64 | 1,230,319(0.03%)#611 |
| 65. | Sycamore | 311 | 86,493(0.36%)#65 | 1,230,319(0.03%)#618 |
| 66. | Burr Ridge | 311 | 86,493(0.36%)#66 | 1,230,319(0.03%)#619 |
| 67. | Lake Zurich | 308 | 86,493(0.36%)#67 | 1,230,319(0.03%)#625 |
| 68. | Lake In The Hills | 299 | 86,493(0.35%)#68 | 1,230,319(0.02%)#648 |
| 69. | Winthrop Harbor | 299 | 86,493(0.35%)#69 | 1,230,319(0.02%)#654 |
| 70. | Palos Heights | 286 | 86,493(0.33%)#70 | 1,230,319(0.02%)#684 |
| 71. | Barrington | 284 | 86,493(0.33%)#71 | 1,230,319(0.02%)#693 |
| 72. | Crystal Lake | 280 | 86,493(0.32%)#72 | 1,230,319(0.02%)#714 |
| 73. | Campton Hills | 271 | 86,493(0.31%)#73 | 1,230,319(0.02%)#743 |
| 74. | Waukegan | 265 | 86,493(0.31%)#74 | 1,230,319(0.02%)#764 |
| 75. | Forest Park | 261 | 86,493(0.30%)#75 | 1,230,319(0.02%)#776 |
| 76. | River Grove | 260 | 86,493(0.30%)#76 | 1,230,319(0.02%)#779 |
| 77. | Westchester | 258 | 86,493(0.30%)#77 | 1,230,319(0.02%)#795 |
| 78. | Lockport | 250 | 86,493(0.29%)#78 | 1,230,319(0.02%)#821 |
| 79. | South Barrington | 249 | 86,493(0.29%)#79 | 1,230,319(0.02%)#828 |
| 80. | Elk Grove Village | 242 | 86,493(0.28%)#80 | 1,230,319(0.02%)#855 |
| 81. | Alsip | 241 | 86,493(0.28%)#81 | 1,230,319(0.02%)#860 |
| 82. | Schiller Park | 235 | 86,493(0.27%)#82 | 1,230,319(0.02%)#878 |
| 83. | Columbia | 233 | 86,493(0.27%)#83 | 1,230,319(0.02%)#882 |
| 84. | Grayslake | 232 | 86,493(0.27%)#84 | 1,230,319(0.02%)#888 |
| 85. | Inverness | 230 | 86,493(0.27%)#85 | 1,230,319(0.02%)#896 |
| 86. | Urbana | 221 | 86,493(0.26%)#86 | 1,230,319(0.02%)#940 |
| 87. | Vernon Hills | 220 | 86,493(0.25%)#87 | 1,230,319(0.02%)#947 |
| 88. | Batavia | 220 | 86,493(0.25%)#88 | 1,230,319(0.02%)#948 |
| 89. | Mokena | 217 | 86,493(0.25%)#89 | 1,230,319(0.02%)#968 |
| 90. | Oak Forest | 212 | 86,493(0.25%)#90 | 1,230,319(0.02%)#992 |
| 91. | Moline | 207 | 86,493(0.24%)#91 | 1,230,319(0.02%)#1,019 |
| 92. | Woodstock | 205 | 86,493(0.24%)#92 | 1,230,319(0.02%)#1,031 |
| 93. | Prospect Heights | 203 | 86,493(0.23%)#93 | 1,230,319(0.02%)#1,042 |
| 94. | Buffalo Grove | 202 | 86,493(0.23%)#94 | 1,230,319(0.02%)#1,046 |
| 95. | Barrington Hills | 201 | 86,493(0.23%)#95 | 1,230,319(0.02%)#1,056 |
| 96. | Bloomington | 200 | 86,493(0.23%)#96 | 1,230,319(0.02%)#1,059 |
| 97. | Oswego | 200 | 86,493(0.23%)#97 | 1,230,319(0.02%)#1,061 |
| 98. | Frankfort | 199 | 86,493(0.23%)#98 | 1,230,319(0.02%)#1,066 |
| 99. | Homer Glen | 198 | 86,493(0.23%)#99 | 1,230,319(0.02%)#1,075 |
| 100. | Warrenville | 196 | 86,493(0.23%)#100 | 1,230,319(0.02%)#1,091 |
Common Questions
What are the Top 10 Cities with the Largest Greek Community in Illinois?
Top 10 Cities with the Largest Greek Community in Illinois are:
#1
16,404
#2
1,667
#3
1,667
#4
1,517
#5
1,422
#6
1,371
#7
1,098
#8
1,079
#9
1,044
#10
924
What city has the Largest Greek Community in Illinois?
Chicago has the Largest Greek Community in Illinois with 16,404.
What is the Total Greek Population in the State of Illinois?
Total Greek Population in Illinois is 86,493.
What is the Total Greek Population in the United States?
Total Greek Population in the United States is 1,230,319.