Cities with the Largest Greek Community in New York
RELATED REPORTS & OPTIONS
Greek
New York
Compare Cities
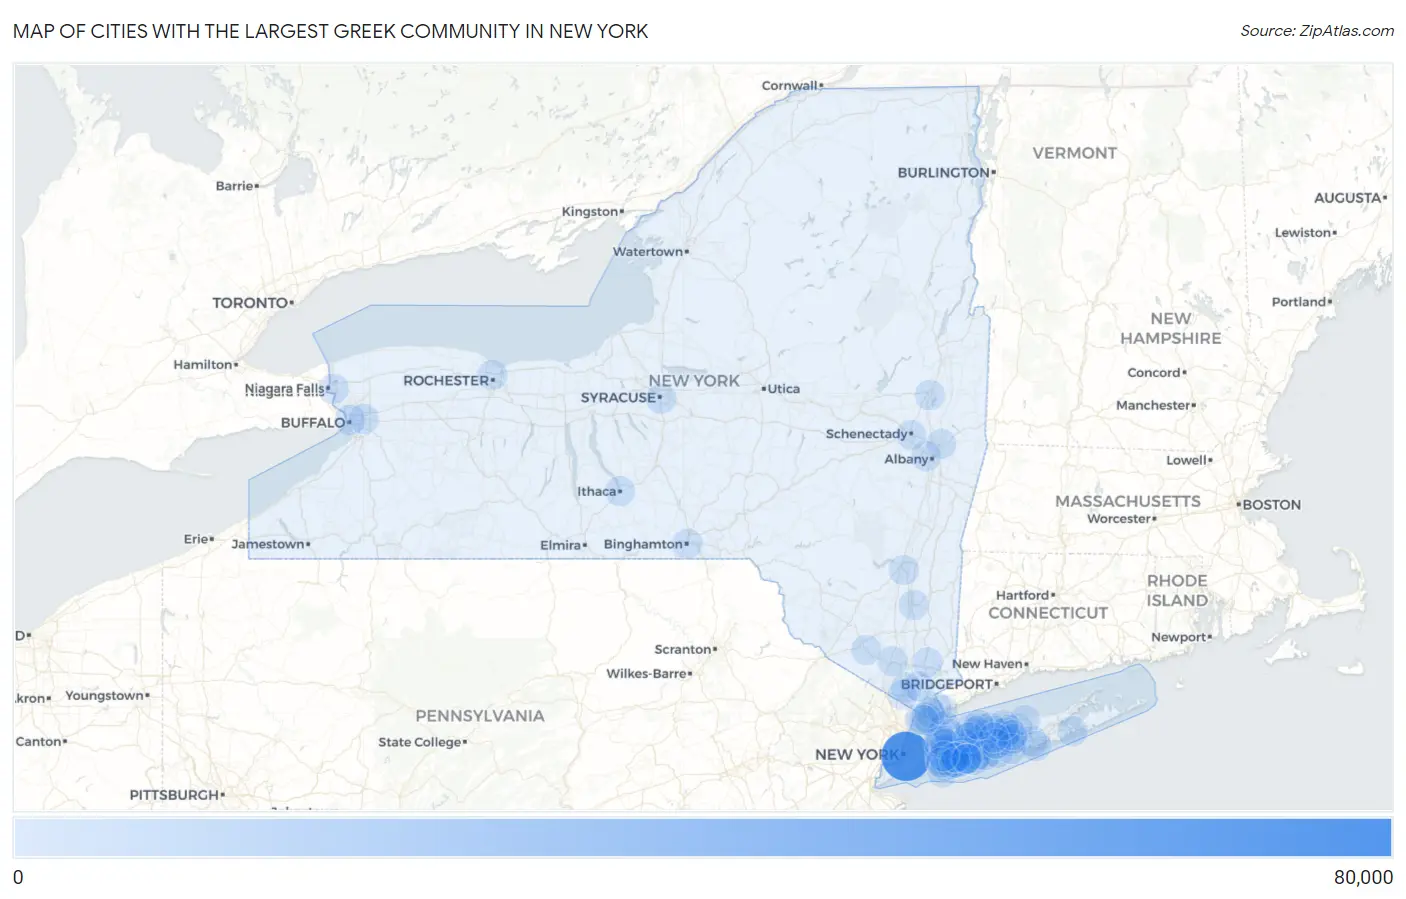
Map of Cities with the Largest Greek Community in New York
0
80,000
Cities with the Largest Greek Community in New York
| City | Greek | vs State | vs National | |
| 1. | New York | 62,944 | 142,618(44.13%)#1 | 1,230,319(5.12%)#1 |
| 2. | Yonkers | 1,166 | 142,618(0.82%)#2 | 1,230,319(0.09%)#73 |
| 3. | Melville | 1,107 | 142,618(0.78%)#3 | 1,230,319(0.09%)#82 |
| 4. | Commack | 962 | 142,618(0.67%)#4 | 1,230,319(0.08%)#101 |
| 5. | Smithtown | 913 | 142,618(0.64%)#5 | 1,230,319(0.07%)#114 |
| 6. | Buffalo | 889 | 142,618(0.62%)#6 | 1,230,319(0.07%)#122 |
| 7. | South Farmingdale | 808 | 142,618(0.57%)#7 | 1,230,319(0.07%)#142 |
| 8. | Syosset | 755 | 142,618(0.53%)#8 | 1,230,319(0.06%)#159 |
| 9. | Wantagh | 667 | 142,618(0.47%)#9 | 1,230,319(0.05%)#192 |
| 10. | Franklin Square | 655 | 142,618(0.46%)#10 | 1,230,319(0.05%)#199 |
| 11. | Bellmore | 630 | 142,618(0.44%)#11 | 1,230,319(0.05%)#214 |
| 12. | Coram | 623 | 142,618(0.44%)#12 | 1,230,319(0.05%)#217 |
| 13. | Rochester | 618 | 142,618(0.43%)#13 | 1,230,319(0.05%)#220 |
| 14. | Shirley | 615 | 142,618(0.43%)#14 | 1,230,319(0.05%)#221 |
| 15. | Hicksville | 611 | 142,618(0.43%)#15 | 1,230,319(0.05%)#225 |
| 16. | Dix Hills | 603 | 142,618(0.42%)#16 | 1,230,319(0.05%)#235 |
| 17. | Syracuse | 588 | 142,618(0.41%)#17 | 1,230,319(0.05%)#244 |
| 18. | Bethpage | 574 | 142,618(0.40%)#18 | 1,230,319(0.05%)#252 |
| 19. | Lake Ronkonkoma | 571 | 142,618(0.40%)#19 | 1,230,319(0.05%)#257 |
| 20. | Levittown | 569 | 142,618(0.40%)#20 | 1,230,319(0.05%)#259 |
| 21. | Nesconset | 568 | 142,618(0.40%)#21 | 1,230,319(0.05%)#260 |
| 22. | Albany | 566 | 142,618(0.40%)#22 | 1,230,319(0.05%)#262 |
| 23. | East Meadow | 543 | 142,618(0.38%)#23 | 1,230,319(0.04%)#274 |
| 24. | Malverne | 529 | 142,618(0.37%)#24 | 1,230,319(0.04%)#291 |
| 25. | East Northport | 520 | 142,618(0.36%)#25 | 1,230,319(0.04%)#297 |
| 26. | Rockville Centre | 445 | 142,618(0.31%)#26 | 1,230,319(0.04%)#360 |
| 27. | Huntington Station | 443 | 142,618(0.31%)#27 | 1,230,319(0.04%)#363 |
| 28. | Hampton Bays | 441 | 142,618(0.31%)#28 | 1,230,319(0.04%)#364 |
| 29. | New Hyde Park | 437 | 142,618(0.31%)#29 | 1,230,319(0.04%)#375 |
| 30. | Centereach | 433 | 142,618(0.30%)#30 | 1,230,319(0.04%)#379 |
| 31. | Binghamton | 432 | 142,618(0.30%)#31 | 1,230,319(0.04%)#381 |
| 32. | Rocky Point | 432 | 142,618(0.30%)#32 | 1,230,319(0.04%)#382 |
| 33. | Cheektowaga | 426 | 142,618(0.30%)#33 | 1,230,319(0.03%)#391 |
| 34. | Plainview | 425 | 142,618(0.30%)#34 | 1,230,319(0.03%)#395 |
| 35. | North Massapequa | 418 | 142,618(0.29%)#35 | 1,230,319(0.03%)#405 |
| 36. | Garden City | 416 | 142,618(0.29%)#36 | 1,230,319(0.03%)#409 |
| 37. | Manhasset | 415 | 142,618(0.29%)#37 | 1,230,319(0.03%)#411 |
| 38. | Huntington | 414 | 142,618(0.29%)#38 | 1,230,319(0.03%)#413 |
| 39. | New Rochelle | 408 | 142,618(0.29%)#39 | 1,230,319(0.03%)#424 |
| 40. | Ithaca | 405 | 142,618(0.28%)#40 | 1,230,319(0.03%)#431 |
| 41. | Seaford | 404 | 142,618(0.28%)#41 | 1,230,319(0.03%)#432 |
| 42. | Plainedge | 399 | 142,618(0.28%)#42 | 1,230,319(0.03%)#447 |
| 43. | Harrison | 381 | 142,618(0.27%)#43 | 1,230,319(0.03%)#473 |
| 44. | Woodbury | 356 | 142,618(0.25%)#44 | 1,230,319(0.03%)#511 |
| 45. | Lindenhurst | 353 | 142,618(0.25%)#45 | 1,230,319(0.03%)#518 |
| 46. | Greenlawn | 352 | 142,618(0.25%)#46 | 1,230,319(0.03%)#522 |
| 47. | Glen Cove | 350 | 142,618(0.25%)#47 | 1,230,319(0.03%)#525 |
| 48. | Port Washington | 349 | 142,618(0.24%)#48 | 1,230,319(0.03%)#528 |
| 49. | Eastchester | 344 | 142,618(0.24%)#49 | 1,230,319(0.03%)#537 |
| 50. | De Witt | 329 | 142,618(0.23%)#50 | 1,230,319(0.03%)#572 |
| 51. | Long Beach | 307 | 142,618(0.22%)#51 | 1,230,319(0.02%)#626 |
| 52. | Ronkonkoma | 306 | 142,618(0.21%)#52 | 1,230,319(0.02%)#629 |
| 53. | Holbrook | 303 | 142,618(0.21%)#53 | 1,230,319(0.02%)#636 |
| 54. | Oceanside | 302 | 142,618(0.21%)#54 | 1,230,319(0.02%)#642 |
| 55. | Mineola | 299 | 142,618(0.21%)#55 | 1,230,319(0.02%)#650 |
| 56. | Lake Grove | 299 | 142,618(0.21%)#56 | 1,230,319(0.02%)#653 |
| 57. | Massapequa | 297 | 142,618(0.21%)#57 | 1,230,319(0.02%)#657 |
| 58. | Deer Park | 294 | 142,618(0.21%)#58 | 1,230,319(0.02%)#661 |
| 59. | Glen Head | 292 | 142,618(0.20%)#59 | 1,230,319(0.02%)#672 |
| 60. | Roslyn Heights | 288 | 142,618(0.20%)#60 | 1,230,319(0.02%)#679 |
| 61. | Kings Park | 286 | 142,618(0.20%)#61 | 1,230,319(0.02%)#683 |
| 62. | Troy | 285 | 142,618(0.20%)#62 | 1,230,319(0.02%)#687 |
| 63. | North Wantagh | 277 | 142,618(0.19%)#63 | 1,230,319(0.02%)#725 |
| 64. | Bay Shore | 269 | 142,618(0.19%)#64 | 1,230,319(0.02%)#750 |
| 65. | Jefferson Valley Yorktown | 264 | 142,618(0.19%)#65 | 1,230,319(0.02%)#770 |
| 66. | Copiague | 260 | 142,618(0.18%)#66 | 1,230,319(0.02%)#777 |
| 67. | West Babylon | 258 | 142,618(0.18%)#67 | 1,230,319(0.02%)#792 |
| 68. | Mastic Beach | 249 | 142,618(0.17%)#68 | 1,230,319(0.02%)#826 |
| 69. | East Islip | 249 | 142,618(0.17%)#69 | 1,230,319(0.02%)#827 |
| 70. | Holtsville | 247 | 142,618(0.17%)#70 | 1,230,319(0.02%)#835 |
| 71. | Flower Hill | 237 | 142,618(0.17%)#71 | 1,230,319(0.02%)#872 |
| 72. | Bayport | 236 | 142,618(0.17%)#72 | 1,230,319(0.02%)#873 |
| 73. | Freeport | 235 | 142,618(0.16%)#73 | 1,230,319(0.02%)#876 |
| 74. | Port Chester | 229 | 142,618(0.16%)#74 | 1,230,319(0.02%)#900 |
| 75. | Farmingville | 229 | 142,618(0.16%)#75 | 1,230,319(0.02%)#902 |
| 76. | Lynbrook | 228 | 142,618(0.16%)#76 | 1,230,319(0.02%)#907 |
| 77. | North Merrick | 228 | 142,618(0.16%)#77 | 1,230,319(0.02%)#908 |
| 78. | Saratoga Springs | 225 | 142,618(0.16%)#78 | 1,230,319(0.02%)#925 |
| 79. | New City | 220 | 142,618(0.15%)#79 | 1,230,319(0.02%)#945 |
| 80. | West Islip | 220 | 142,618(0.15%)#80 | 1,230,319(0.02%)#946 |
| 81. | Niagara Falls | 217 | 142,618(0.15%)#81 | 1,230,319(0.02%)#965 |
| 82. | Central Islip | 216 | 142,618(0.15%)#82 | 1,230,319(0.02%)#974 |
| 83. | Scarsdale | 216 | 142,618(0.15%)#83 | 1,230,319(0.02%)#975 |
| 84. | Merrick | 210 | 142,618(0.15%)#84 | 1,230,319(0.02%)#1,000 |
| 85. | West Hills | 198 | 142,618(0.14%)#85 | 1,230,319(0.02%)#1,077 |
| 86. | Massapequa Park | 197 | 142,618(0.14%)#86 | 1,230,319(0.02%)#1,083 |
| 87. | Ossining | 196 | 142,618(0.14%)#87 | 1,230,319(0.02%)#1,088 |
| 88. | Poughkeepsie | 195 | 142,618(0.14%)#88 | 1,230,319(0.02%)#1,096 |
| 89. | Carmel | 195 | 142,618(0.14%)#89 | 1,230,319(0.02%)#1,100 |
| 90. | Goshen | 195 | 142,618(0.14%)#90 | 1,230,319(0.02%)#1,101 |
| 91. | Kingston | 189 | 142,618(0.13%)#91 | 1,230,319(0.02%)#1,131 |
| 92. | East Massapequa | 186 | 142,618(0.13%)#92 | 1,230,319(0.02%)#1,144 |
| 93. | Stony Brook | 186 | 142,618(0.13%)#93 | 1,230,319(0.02%)#1,145 |
| 94. | Nanuet | 181 | 142,618(0.13%)#94 | 1,230,319(0.01%)#1,165 |
| 95. | Schenectady | 179 | 142,618(0.13%)#95 | 1,230,319(0.01%)#1,174 |
| 96. | Hauppauge | 179 | 142,618(0.13%)#96 | 1,230,319(0.01%)#1,178 |
| 97. | Northport | 179 | 142,618(0.13%)#97 | 1,230,319(0.01%)#1,181 |
| 98. | Bronxville | 179 | 142,618(0.13%)#98 | 1,230,319(0.01%)#1,182 |
| 99. | North Bellmore | 176 | 142,618(0.12%)#99 | 1,230,319(0.01%)#1,201 |
| 100. | West Hempstead | 171 | 142,618(0.12%)#100 | 1,230,319(0.01%)#1,236 |
Common Questions
What are the Top 10 Cities with the Largest Greek Community in New York?
Top 10 Cities with the Largest Greek Community in New York are:
#1
62,944
#2
1,166
#3
1,107
#4
962
#5
913
#6
889
#7
808
#8
755
#9
667
#10
655
What city has the Largest Greek Community in New York?
New York has the Largest Greek Community in New York with 62,944.
What is the Total Greek Population in the State of New York?
Total Greek Population in New York is 142,618.
What is the Total Greek Population in the United States?
Total Greek Population in the United States is 1,230,319.