Cities with the Highest Percentage of Norwegian Population in Connecticut
RELATED REPORTS & OPTIONS
Norwegian
Connecticut
Compare Cities
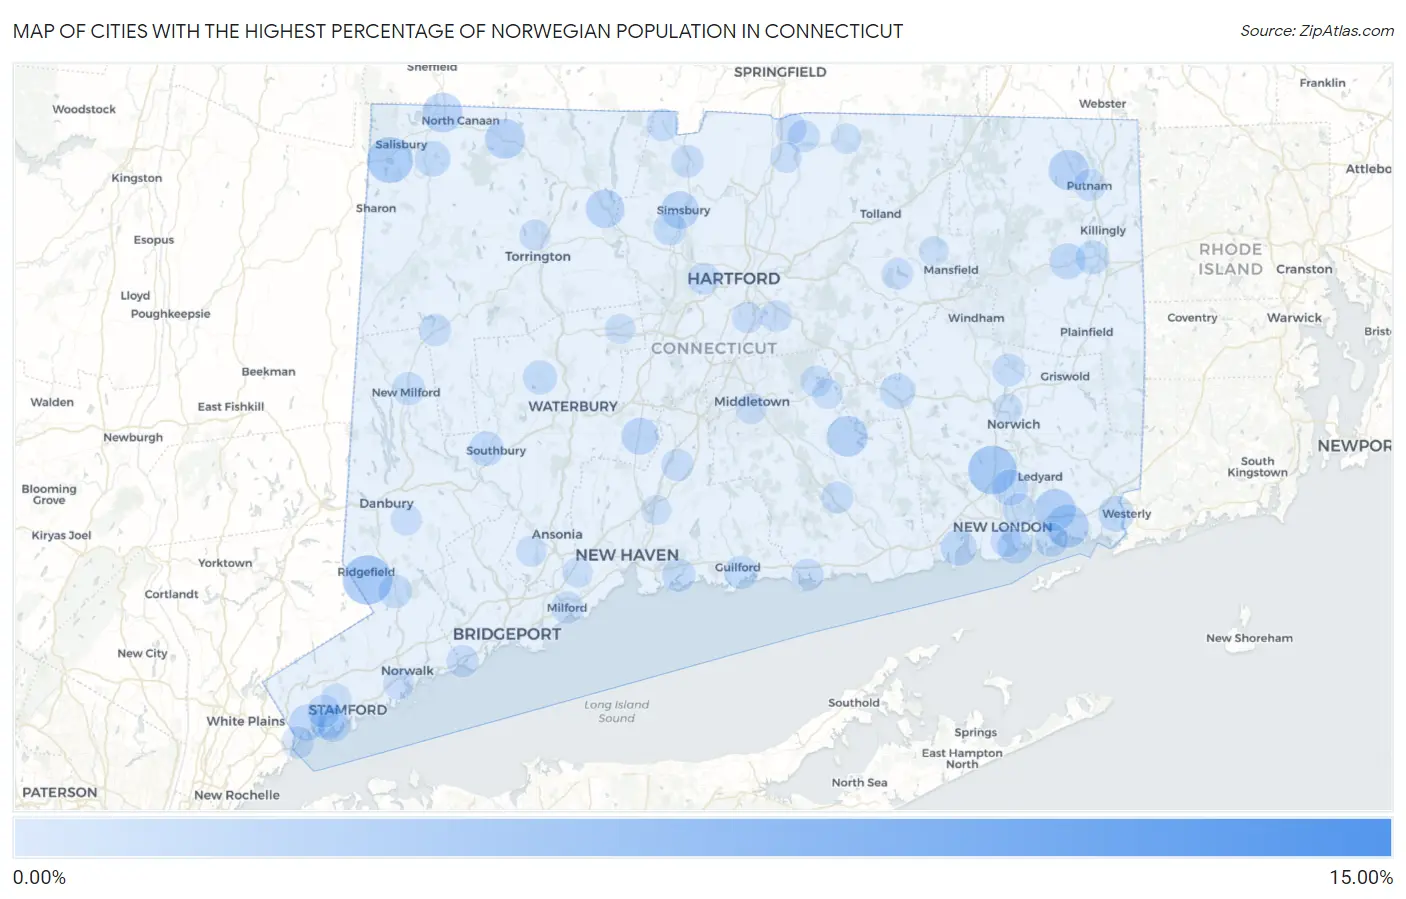
Map of Cities with the Highest Percentage of Norwegian Population in Connecticut
0.00%
15.00%
Cities with the Highest Percentage of Norwegian Population in Connecticut
| City | Norwegian | vs State | vs National | |
| 1. | Cornwall | 13.25% | 0.47%(+12.8)#1 | 1.25%(+12.0)#1,392 |
| 2. | Indian Field | 4.43% | 0.47%(+3.96)#2 | 1.25%(+3.19)#3,632 |
| 3. | Taylor Corners | 4.24% | 0.47%(+3.77)#3 | 1.25%(+2.99)#3,777 |
| 4. | Botsford | 4.03% | 0.47%(+3.55)#4 | 1.25%(+2.78)#3,913 |
| 5. | Ridgefield | 3.66% | 0.47%(+3.18)#5 | 1.25%(+2.41)#4,221 |
| 6. | Oxoboxo River | 3.54% | 0.47%(+3.07)#6 | 1.25%(+2.30)#4,328 |
| 7. | Gaylordsville | 3.53% | 0.47%(+3.06)#7 | 1.25%(+2.29)#4,333 |
| 8. | Poplar Plains | 3.49% | 0.47%(+3.02)#8 | 1.25%(+2.25)#4,356 |
| 9. | Compo | 3.22% | 0.47%(+2.74)#9 | 1.25%(+1.97)#4,639 |
| 10. | Lakeville | 3.05% | 0.47%(+2.57)#10 | 1.25%(+1.80)#4,817 |
| 11. | Candlewood Knolls | 2.94% | 0.47%(+2.47)#11 | 1.25%(+1.70)#4,922 |
| 12. | Mamanasco Lake | 2.77% | 0.47%(+2.29)#12 | 1.25%(+1.52)#5,126 |
| 13. | Jewett City Borough | 2.69% | 0.47%(+2.22)#13 | 1.25%(+1.45)#5,207 |
| 14. | Stonington Borough | 2.55% | 0.47%(+2.07)#14 | 1.25%(+1.30)#5,402 |
| 15. | Mystic | 2.51% | 0.47%(+2.04)#15 | 1.25%(+1.27)#5,458 |
| 16. | Old Mystic | 2.36% | 0.47%(+1.89)#16 | 1.25%(+1.12)#5,667 |
| 17. | Candlewood Shores | 2.27% | 0.47%(+1.80)#17 | 1.25%(+1.03)#5,795 |
| 18. | Mechanicsville | 2.21% | 0.47%(+1.74)#18 | 1.25%(+0.969)#5,890 |
| 19. | Trumbull Center | 2.18% | 0.47%(+1.70)#19 | 1.25%(+0.932)#5,957 |
| 20. | Moodus | 2.16% | 0.47%(+1.69)#20 | 1.25%(+0.915)#5,987 |
| 21. | South Woodstock | 2.05% | 0.47%(+1.57)#21 | 1.25%(+0.800)#6,185 |
| 22. | Canaan | 2.00% | 0.47%(+1.52)#22 | 1.25%(+0.750)#6,280 |
| 23. | Norfolk | 1.99% | 0.47%(+1.52)#23 | 1.25%(+0.748)#6,282 |
| 24. | New Hartford Center | 1.76% | 0.47%(+1.29)#24 | 1.25%(+0.514)#6,764 |
| 25. | Old Hill | 1.68% | 0.47%(+1.21)#25 | 1.25%(+0.435)#6,928 |
| 26. | Simsbury Center | 1.60% | 0.47%(+1.13)#26 | 1.25%(+0.358)#7,131 |
| 27. | Cheshire Village | 1.50% | 0.47%(+1.02)#27 | 1.25%(+0.251)#7,430 |
| 28. | Rock Ridge | 1.44% | 0.47%(+0.961)#28 | 1.25%(+0.190)#7,580 |
| 29. | Niantic | 1.40% | 0.47%(+0.927)#29 | 1.25%(+0.156)#7,675 |
| 30. | Greenwich | 1.39% | 0.47%(+0.921)#30 | 1.25%(+0.149)#7,695 |
| 31. | Brooklyn | 1.35% | 0.47%(+0.880)#31 | 1.25%(+0.109)#7,818 |
| 32. | Gales Ferry | 1.35% | 0.47%(+0.873)#32 | 1.25%(+0.102)#7,851 |
| 33. | Noroton | 1.34% | 0.47%(+0.864)#33 | 1.25%(+0.093)#7,886 |
| 34. | Litchfield Borough | 1.33% | 0.47%(+0.854)#34 | 1.25%(+0.083)#7,919 |
| 35. | Pawcatuck | 1.31% | 0.47%(+0.836)#35 | 1.25%(+0.065)#7,960 |
| 36. | Bantam Borough | 1.29% | 0.47%(+0.817)#36 | 1.25%(+0.046)#8,009 |
| 37. | Falls Village | 1.27% | 0.47%(+0.794)#37 | 1.25%(+0.023)#8,091 |
| 38. | Colchester | 1.25% | 0.47%(+0.779)#38 | 1.25%(+0.008)#8,153 |
| 39. | Groton | 1.15% | 0.47%(+0.679)#39 | 1.25%(-0.092)#8,494 |
| 40. | Heritage Village | 1.13% | 0.47%(+0.659)#40 | 1.25%(-0.112)#8,573 |
| 41. | Riverside | 1.07% | 0.47%(+0.592)#41 | 1.25%(-0.179)#8,820 |
| 42. | Watertown | 1.01% | 0.47%(+0.535)#42 | 1.25%(-0.236)#9,104 |
| 43. | Saugatuck | 1.00% | 0.47%(+0.526)#43 | 1.25%(-0.245)#9,145 |
| 44. | Old Greenwich | 0.98% | 0.47%(+0.503)#44 | 1.25%(-0.268)#9,250 |
| 45. | East Brooklyn | 0.98% | 0.47%(+0.501)#45 | 1.25%(-0.270)#9,261 |
| 46. | Ball Pond | 0.95% | 0.47%(+0.474)#46 | 1.25%(-0.297)#9,382 |
| 47. | Noank | 0.94% | 0.47%(+0.462)#47 | 1.25%(-0.309)#9,425 |
| 48. | Georgetown | 0.91% | 0.47%(+0.431)#48 | 1.25%(-0.340)#9,574 |
| 49. | Guilford Center | 0.91% | 0.47%(+0.431)#49 | 1.25%(-0.340)#9,580 |
| 50. | Weatogue | 0.86% | 0.47%(+0.387)#50 | 1.25%(-0.384)#9,804 |
| 51. | Branford Center | 0.85% | 0.47%(+0.380)#51 | 1.25%(-0.391)#9,837 |
| 52. | New Milford | 0.82% | 0.47%(+0.343)#52 | 1.25%(-0.428)#10,051 |
| 53. | Conning Towers Nautilus Park | 0.82% | 0.47%(+0.342)#53 | 1.25%(-0.429)#10,060 |
| 54. | Tashua | 0.79% | 0.47%(+0.319)#54 | 1.25%(-0.452)#10,202 |
| 55. | Cos Cob | 0.79% | 0.47%(+0.313)#55 | 1.25%(-0.458)#10,236 |
| 56. | Baltic | 0.78% | 0.47%(+0.308)#56 | 1.25%(-0.463)#10,266 |
| 57. | Weston | 0.75% | 0.47%(+0.278)#57 | 1.25%(-0.493)#10,457 |
| 58. | Salmon Brook | 0.73% | 0.47%(+0.258)#58 | 1.25%(-0.513)#10,563 |
| 59. | Ridgebury | 0.73% | 0.47%(+0.257)#59 | 1.25%(-0.514)#10,572 |
| 60. | North Granby | 0.71% | 0.47%(+0.233)#60 | 1.25%(-0.538)#10,729 |
| 61. | Clinton | 0.71% | 0.47%(+0.232)#61 | 1.25%(-0.539)#10,734 |
| 62. | Byram | 0.70% | 0.47%(+0.226)#62 | 1.25%(-0.545)#10,781 |
| 63. | Wallingford Center | 0.70% | 0.47%(+0.225)#63 | 1.25%(-0.546)#10,790 |
| 64. | Lakes East | 0.69% | 0.47%(+0.212)#64 | 1.25%(-0.559)#10,888 |
| 65. | New Preston | 0.68% | 0.47%(+0.208)#65 | 1.25%(-0.563)#10,926 |
| 66. | Hazardville | 0.67% | 0.47%(+0.195)#66 | 1.25%(-0.576)#11,022 |
| 67. | Southport | 0.66% | 0.47%(+0.186)#67 | 1.25%(-0.585)#11,096 |
| 68. | Milford City Balance | 0.65% | 0.47%(+0.173)#68 | 1.25%(-0.598)#11,196 |
| 69. | Putnam | 0.64% | 0.47%(+0.164)#69 | 1.25%(-0.607)#11,246 |
| 70. | Westport | 0.64% | 0.47%(+0.163)#70 | 1.25%(-0.608)#11,259 |
| 71. | Chester Center | 0.64% | 0.47%(+0.162)#71 | 1.25%(-0.609)#11,272 |
| 72. | West Hartford | 0.62% | 0.47%(+0.147)#72 | 1.25%(-0.624)#11,378 |
| 73. | Woodmont Borough | 0.62% | 0.47%(+0.143)#73 | 1.25%(-0.628)#11,399 |
| 74. | Newtown Borough | 0.61% | 0.47%(+0.138)#74 | 1.25%(-0.633)#11,436 |
| 75. | Sandy Hook | 0.56% | 0.47%(+0.088)#75 | 1.25%(-0.683)#11,812 |
| 76. | Inglenook | 0.55% | 0.47%(+0.080)#76 | 1.25%(-0.691)#11,865 |
| 77. | Glastonbury Center | 0.55% | 0.47%(+0.078)#77 | 1.25%(-0.693)#11,879 |
| 78. | Lake Pocotopaug | 0.55% | 0.47%(+0.072)#78 | 1.25%(-0.699)#11,936 |
| 79. | Coventry Lake | 0.54% | 0.47%(+0.064)#79 | 1.25%(-0.707)#11,988 |
| 80. | New London | 0.54% | 0.47%(+0.062)#80 | 1.25%(-0.709)#12,003 |
| 81. | Quinnipiac University | 0.51% | 0.47%(+0.033)#81 | 1.25%(-0.738)#12,235 |
| 82. | Sherwood Manor | 0.51% | 0.47%(+0.032)#82 | 1.25%(-0.739)#12,245 |
| 83. | Norwalk | 0.49% | 0.47%(+0.015)#83 | 1.25%(-0.756)#12,383 |
| 84. | Bethel | 0.48% | 0.47%(+0.010)#84 | 1.25%(-0.761)#12,433 |
| 85. | Torrington | 0.48% | 0.47%(+0.010)#85 | 1.25%(-0.761)#12,437 |
| 86. | Wethersfield | 0.48% | 0.47%(+0.007)#86 | 1.25%(-0.764)#12,455 |
| 87. | Fairfield University | 0.44% | 0.47%(-0.033)#87 | 1.25%(-0.804)#12,822 |
| 88. | Middletown | 0.43% | 0.47%(-0.047)#88 | 1.25%(-0.818)#12,955 |
| 89. | Greens Farms | 0.43% | 0.47%(-0.048)#89 | 1.25%(-0.819)#12,968 |
| 90. | Southwood Acres | 0.42% | 0.47%(-0.058)#90 | 1.25%(-0.829)#13,065 |
| 91. | Shelton | 0.38% | 0.47%(-0.091)#91 | 1.25%(-0.862)#13,375 |
| 92. | East Hampton | 0.37% | 0.47%(-0.101)#92 | 1.25%(-0.872)#13,478 |
| 93. | Stamford | 0.37% | 0.47%(-0.108)#93 | 1.25%(-0.879)#13,557 |
| 94. | Somers | 0.36% | 0.47%(-0.116)#94 | 1.25%(-0.887)#13,628 |
| 95. | Orange | 0.35% | 0.47%(-0.123)#95 | 1.25%(-0.894)#13,701 |
| 96. | Bristol | 0.32% | 0.47%(-0.153)#96 | 1.25%(-0.924)#13,983 |
| 97. | Storrs | 0.31% | 0.47%(-0.162)#97 | 1.25%(-0.933)#14,079 |
| 98. | Tokeneke | 0.31% | 0.47%(-0.164)#98 | 1.25%(-0.935)#14,095 |
| 99. | Norwich | 0.31% | 0.47%(-0.165)#99 | 1.25%(-0.936)#14,107 |
| 100. | North Haven | 0.30% | 0.47%(-0.177)#100 | 1.25%(-0.948)#14,229 |
Common Questions
What are the Top 10 Cities with the Highest Percentage of Norwegian Population in Connecticut?
Top 10 Cities with the Highest Percentage of Norwegian Population in Connecticut are:
#1
3.66%
#2
3.54%
#3
3.05%
#4
2.51%
#5
2.36%
#6
2.16%
#7
2.05%
#8
2.00%
#9
1.99%
#10
1.76%
What city has the Highest Percentage of Norwegian Population in Connecticut?
Ridgefield has the Highest Percentage of Norwegian Population in Connecticut with 3.66%.
What is the Percentage of Norwegian Population in the State of Connecticut?
Percentage of Norwegian Population in Connecticut is 0.47%.
What is the Percentage of Norwegian Population in the United States?
Percentage of Norwegian Population in the United States is 1.25%.