Cities with the Highest Percentage of Immigrants from South Eastern Asia in Iowa
RELATED REPORTS & OPTIONS
South Eastern Asia
Iowa
Compare Cities
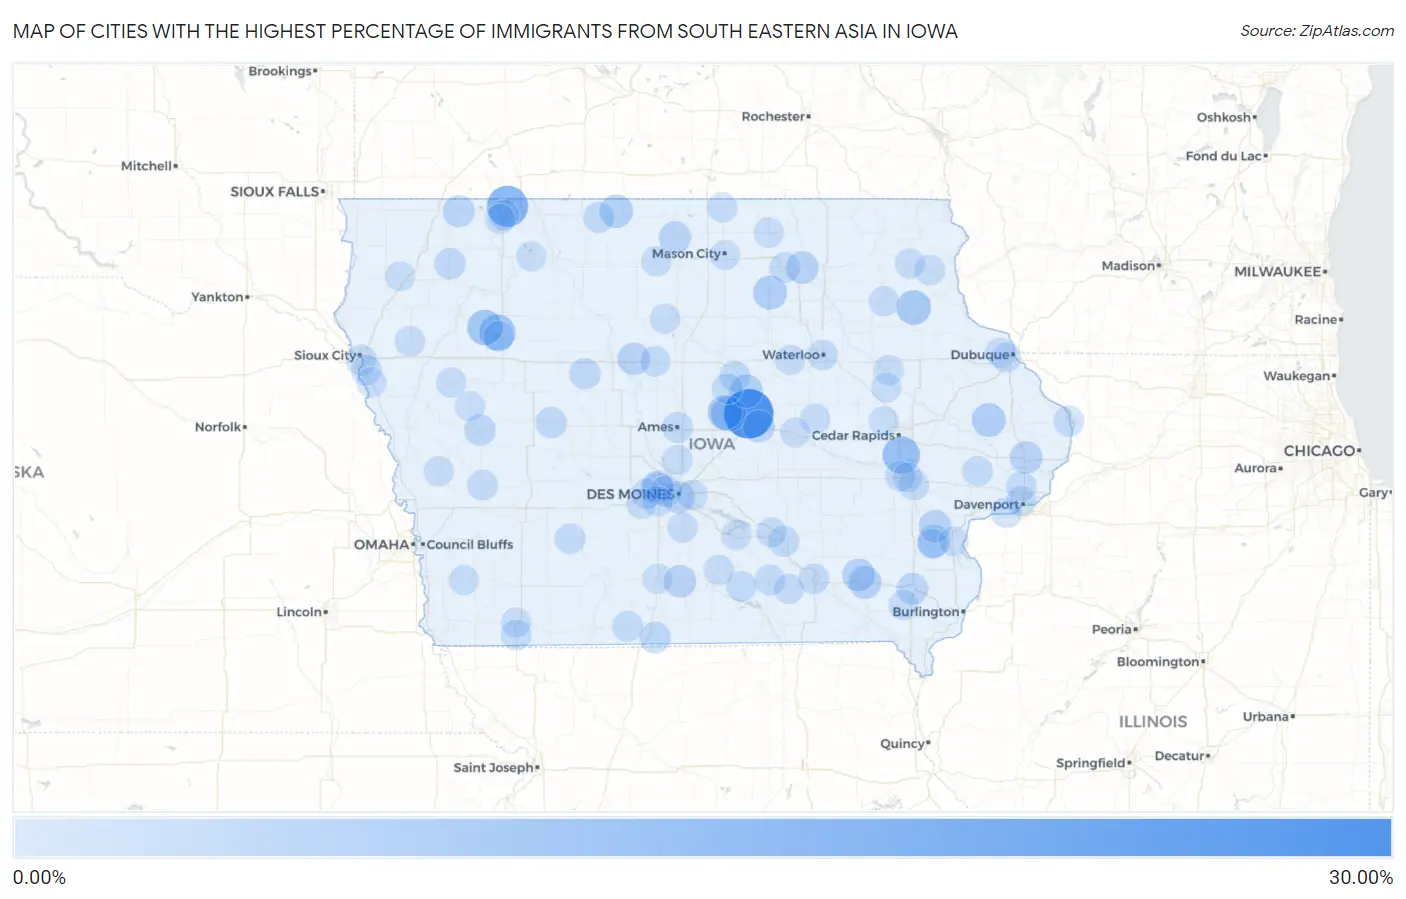
Map of Cities with the Highest Percentage of Immigrants from South Eastern Asia in Iowa
0.00%
30.00%
Cities with the Highest Percentage of Immigrants from South Eastern Asia in Iowa
| City | South Eastern Asia | vs State | vs National | |
| 1. | Albion | 28.67% | 0.81%(+27.9)#-1 | 1.30%(+27.4)#0 |
| 2. | Orleans | 16.23% | 0.81%(+15.4)#0 | 1.30%(+14.9)#1 |
| 3. | Shueyville | 10.82% | 0.81%(+10.0)#1 | 1.30%(+9.53)#2 |
| 4. | Storm Lake | 8.78% | 0.81%(+7.98)#2 | 1.30%(+7.49)#3 |
| 5. | Alta | 8.11% | 0.81%(+7.30)#3 | 1.30%(+6.81)#4 |
| 6. | Clemons | 7.19% | 0.81%(+6.38)#4 | 1.30%(+5.89)#5 |
| 7. | Volga | 6.97% | 0.81%(+6.16)#5 | 1.30%(+5.67)#6 |
| 8. | St Anthony | 6.82% | 0.81%(+6.01)#6 | 1.30%(+5.52)#7 |
| 9. | Greene | 5.84% | 0.81%(+5.03)#7 | 1.30%(+4.54)#8 |
| 10. | Monmouth | 5.63% | 0.81%(+4.83)#8 | 1.30%(+4.34)#9 |
| 11. | Whitten | 5.26% | 0.81%(+4.46)#9 | 1.30%(+3.97)#10 |
| 12. | Ledyard | 5.06% | 0.81%(+4.26)#10 | 1.30%(+3.77)#11 |
| 13. | Columbus Junction | 4.48% | 0.81%(+3.68)#11 | 1.30%(+3.19)#12 |
| 14. | Fairfield | 4.41% | 0.81%(+3.61)#12 | 1.30%(+3.12)#13 |
| 15. | Maharishi Vedic City | 4.36% | 0.81%(+3.56)#13 | 1.30%(+3.07)#14 |
| 16. | Woodburn | 4.00% | 0.81%(+3.19)#14 | 1.30%(+2.70)#15 |
| 17. | Bassett | 4.00% | 0.81%(+3.19)#15 | 1.30%(+2.70)#16 |
| 18. | Dewitt | 3.96% | 0.81%(+3.15)#16 | 1.30%(+2.66)#17 |
| 19. | Duncombe | 3.87% | 0.81%(+3.06)#17 | 1.30%(+2.57)#18 |
| 20. | Conesville | 3.85% | 0.81%(+3.05)#18 | 1.30%(+2.56)#19 |
| 21. | Forest City | 3.64% | 0.81%(+2.84)#19 | 1.30%(+2.35)#20 |
| 22. | Marshalltown | 3.40% | 0.81%(+2.59)#20 | 1.30%(+2.10)#21 |
| 23. | Ocheyedan | 3.29% | 0.81%(+2.49)#21 | 1.30%(+2.00)#22 |
| 24. | Des Moines | 3.25% | 0.81%(+2.45)#22 | 1.30%(+1.95)#23 |
| 25. | Clive | 3.03% | 0.81%(+2.22)#23 | 1.30%(+1.73)#24 |
| 26. | Mount Pleasant | 2.84% | 0.81%(+2.04)#24 | 1.30%(+1.55)#25 |
| 27. | Urbandale | 2.52% | 0.81%(+1.72)#25 | 1.30%(+1.23)#26 |
| 28. | Denison | 2.45% | 0.81%(+1.65)#26 | 1.30%(+1.16)#27 |
| 29. | Davis City | 2.31% | 0.81%(+1.51)#27 | 1.30%(+1.02)#28 |
| 30. | Somers | 2.24% | 0.81%(+1.43)#28 | 1.30%(+0.942)#29 |
| 31. | Windsor Heights | 2.19% | 0.81%(+1.39)#29 | 1.30%(+0.896)#30 |
| 32. | Primghar | 2.18% | 0.81%(+1.38)#30 | 1.30%(+0.888)#31 |
| 33. | Glidden | 2.18% | 0.81%(+1.37)#31 | 1.30%(+0.882)#32 |
| 34. | Beacon | 2.02% | 0.81%(+1.21)#32 | 1.30%(+0.724)#33 |
| 35. | Ames | 1.81% | 0.81%(+1.01)#33 | 1.30%(+0.515)#34 |
| 36. | Eldora | 1.74% | 0.81%(+0.933)#34 | 1.30%(+0.443)#35 |
| 37. | Swea City | 1.74% | 0.81%(+0.933)#35 | 1.30%(+0.443)#36 |
| 38. | Harlan | 1.63% | 0.81%(+0.828)#36 | 1.30%(+0.337)#37 |
| 39. | Kellerton | 1.62% | 0.81%(+0.814)#37 | 1.30%(+0.323)#38 |
| 40. | Charles City | 1.59% | 0.81%(+0.783)#38 | 1.30%(+0.292)#39 |
| 41. | Albia | 1.54% | 0.81%(+0.733)#39 | 1.30%(+0.242)#40 |
| 42. | Fontanelle | 1.48% | 0.81%(+0.675)#40 | 1.30%(+0.184)#41 |
| 43. | Iowa City | 1.47% | 0.81%(+0.663)#41 | 1.30%(+0.173)#345 |
| 44. | Sioux City | 1.46% | 0.81%(+0.658)#42 | 1.30%(+0.167)#346 |
| 45. | Ottumwa | 1.40% | 0.81%(+0.598)#43 | 1.30%(+0.108)#347 |
| 46. | Waterloo | 1.38% | 0.81%(+0.574)#44 | 1.30%(+0.083)#348 |
| 47. | New Providence | 1.34% | 0.81%(+0.534)#45 | 1.30%(+0.043)#349 |
| 48. | Sergeant Bluff | 1.32% | 0.81%(+0.512)#46 | 1.30%(+0.022)#350 |
| 49. | Melrose | 1.32% | 0.81%(+0.510)#47 | 1.30%(+0.019)#351 |
| 50. | Sabula | 1.28% | 0.81%(+0.472)#48 | 1.30%(-0.019)#352 |
| 51. | Webster City | 1.26% | 0.81%(+0.453)#49 | 1.30%(-0.038)#353 |
| 52. | Shambaugh | 1.26% | 0.81%(+0.452)#50 | 1.30%(-0.038)#354 |
| 53. | Buffalo | 1.21% | 0.81%(+0.400)#51 | 1.30%(-0.090)#355 |
| 54. | Bennett | 1.20% | 0.81%(+0.396)#52 | 1.30%(-0.094)#356 |
| 55. | Lakeside | 1.20% | 0.81%(+0.396)#53 | 1.30%(-0.095)#357 |
| 56. | Leighton | 1.12% | 0.81%(+0.312)#54 | 1.30%(-0.179)#358 |
| 57. | Alleman | 1.06% | 0.81%(+0.250)#55 | 1.30%(-0.241)#359 |
| 58. | Knoxville | 1.04% | 0.81%(+0.231)#56 | 1.30%(-0.259)#360 |
| 59. | Pleasant Hill | 1.03% | 0.81%(+0.227)#57 | 1.30%(-0.263)#361 |
| 60. | Okoboji | 1.02% | 0.81%(+0.215)#58 | 1.30%(-0.276)#362 |
| 61. | West Des Moines | 1.02% | 0.81%(+0.214)#59 | 1.30%(-0.277)#363 |
| 62. | Monona | 1.02% | 0.81%(+0.213)#60 | 1.30%(-0.278)#364 |
| 63. | Quasqueton | 0.96% | 0.81%(+0.152)#61 | 1.30%(-0.339)#365 |
| 64. | Postville | 0.94% | 0.81%(+0.137)#62 | 1.30%(-0.354)#366 |
| 65. | Kingsley | 0.94% | 0.81%(+0.135)#63 | 1.30%(-0.356)#367 |
| 66. | Fayette | 0.93% | 0.81%(+0.127)#64 | 1.30%(-0.363)#368 |
| 67. | Osage | 0.92% | 0.81%(+0.114)#65 | 1.30%(-0.377)#369 |
| 68. | Davenport | 0.90% | 0.81%(+0.094)#66 | 1.30%(-0.396)#370 |
| 69. | Eldridge | 0.90% | 0.81%(+0.091)#67 | 1.30%(-0.400)#371 |
| 70. | Salem | 0.89% | 0.81%(+0.082)#68 | 1.30%(-0.409)#372 |
| 71. | Dike | 0.89% | 0.81%(+0.081)#69 | 1.30%(-0.409)#373 |
| 72. | Indianola | 0.88% | 0.81%(+0.078)#70 | 1.30%(-0.413)#374 |
| 73. | Tiffin | 0.87% | 0.81%(+0.061)#71 | 1.30%(-0.429)#375 |
| 74. | Waukee | 0.87% | 0.81%(+0.061)#72 | 1.30%(-0.430)#376 |
| 75. | Battle Creek | 0.84% | 0.81%(+0.038)#73 | 1.30%(-0.453)#377 |
| 76. | Blakesburg | 0.84% | 0.81%(+0.035)#74 | 1.30%(-0.456)#378 |
| 77. | Hastings | 0.79% | 0.81%(-0.018)#75 | 1.30%(-0.509)#379 |
| 78. | Clarinda | 0.78% | 0.81%(-0.024)#76 | 1.30%(-0.514)#380 |
| 79. | Woodbine | 0.78% | 0.81%(-0.028)#77 | 1.30%(-0.519)#381 |
| 80. | Clarion | 0.75% | 0.81%(-0.055)#78 | 1.30%(-0.546)#382 |
| 81. | Van Meter | 0.75% | 0.81%(-0.056)#79 | 1.30%(-0.547)#383 |
| 82. | Northwood | 0.75% | 0.81%(-0.059)#80 | 1.30%(-0.549)#384 |
| 83. | Wahpeton | 0.74% | 0.81%(-0.061)#81 | 1.30%(-0.552)#385 |
| 84. | Clutier | 0.74% | 0.81%(-0.070)#82 | 1.30%(-0.561)#386 |
| 85. | Columbus City | 0.73% | 0.81%(-0.076)#83 | 1.30%(-0.566)#387 |
| 86. | Britt | 0.73% | 0.81%(-0.077)#84 | 1.30%(-0.568)#388 |
| 87. | Williamson | 0.72% | 0.81%(-0.086)#85 | 1.30%(-0.577)#389 |
| 88. | Orange City | 0.70% | 0.81%(-0.105)#86 | 1.30%(-0.595)#390 |
| 89. | Osceola | 0.70% | 0.81%(-0.109)#87 | 1.30%(-0.600)#391 |
| 90. | Asbury | 0.70% | 0.81%(-0.110)#88 | 1.30%(-0.600)#392 |
| 91. | Grandview | 0.69% | 0.81%(-0.114)#89 | 1.30%(-0.605)#393 |
| 92. | Palo | 0.69% | 0.81%(-0.117)#90 | 1.30%(-0.608)#394 |
| 93. | Walker | 0.68% | 0.81%(-0.127)#91 | 1.30%(-0.618)#395 |
| 94. | Salix | 0.67% | 0.81%(-0.133)#92 | 1.30%(-0.624)#396 |
| 95. | Ruthven | 0.67% | 0.81%(-0.135)#93 | 1.30%(-0.626)#397 |
| 96. | Schleswig | 0.64% | 0.81%(-0.163)#94 | 1.30%(-0.653)#398 |
| 97. | Toledo | 0.64% | 0.81%(-0.171)#95 | 1.30%(-0.661)#399 |
| 98. | Dubuque | 0.63% | 0.81%(-0.173)#96 | 1.30%(-0.664)#400 |
| 99. | Coralville | 0.63% | 0.81%(-0.179)#97 | 1.30%(-0.669)#401 |
| 100. | Mason City | 0.62% | 0.81%(-0.182)#98 | 1.30%(-0.673)#402 |
Common Questions
What are the Top 10 Cities with the Highest Percentage of Immigrants from South Eastern Asia in Iowa?
Top 10 Cities with the Highest Percentage of Immigrants from South Eastern Asia in Iowa are:
#1
28.67%
#2
16.23%
#3
10.82%
#4
8.78%
#5
8.11%
#6
7.19%
#7
6.97%
#8
6.82%
#9
5.84%
#10
5.63%
What city has the Highest Percentage of Immigrants from South Eastern Asia in Iowa?
Albion has the Highest Percentage of Immigrants from South Eastern Asia in Iowa with 28.67%.
What is the Percentage of Immigrants from South Eastern Asia in the State of Iowa?
Percentage of Immigrants from South Eastern Asia in Iowa is 0.81%.
What is the Percentage of Immigrants from South Eastern Asia in the United States?
Percentage of Immigrants from South Eastern Asia in the United States is 1.30%.