Cities with the Highest Percentage of Immigrants from South Eastern Asia in Vermont
RELATED REPORTS & OPTIONS
South Eastern Asia
Vermont
Compare Cities
Map of Cities with the Highest Percentage of Immigrants from South Eastern Asia in Vermont
0.00%
5.00%
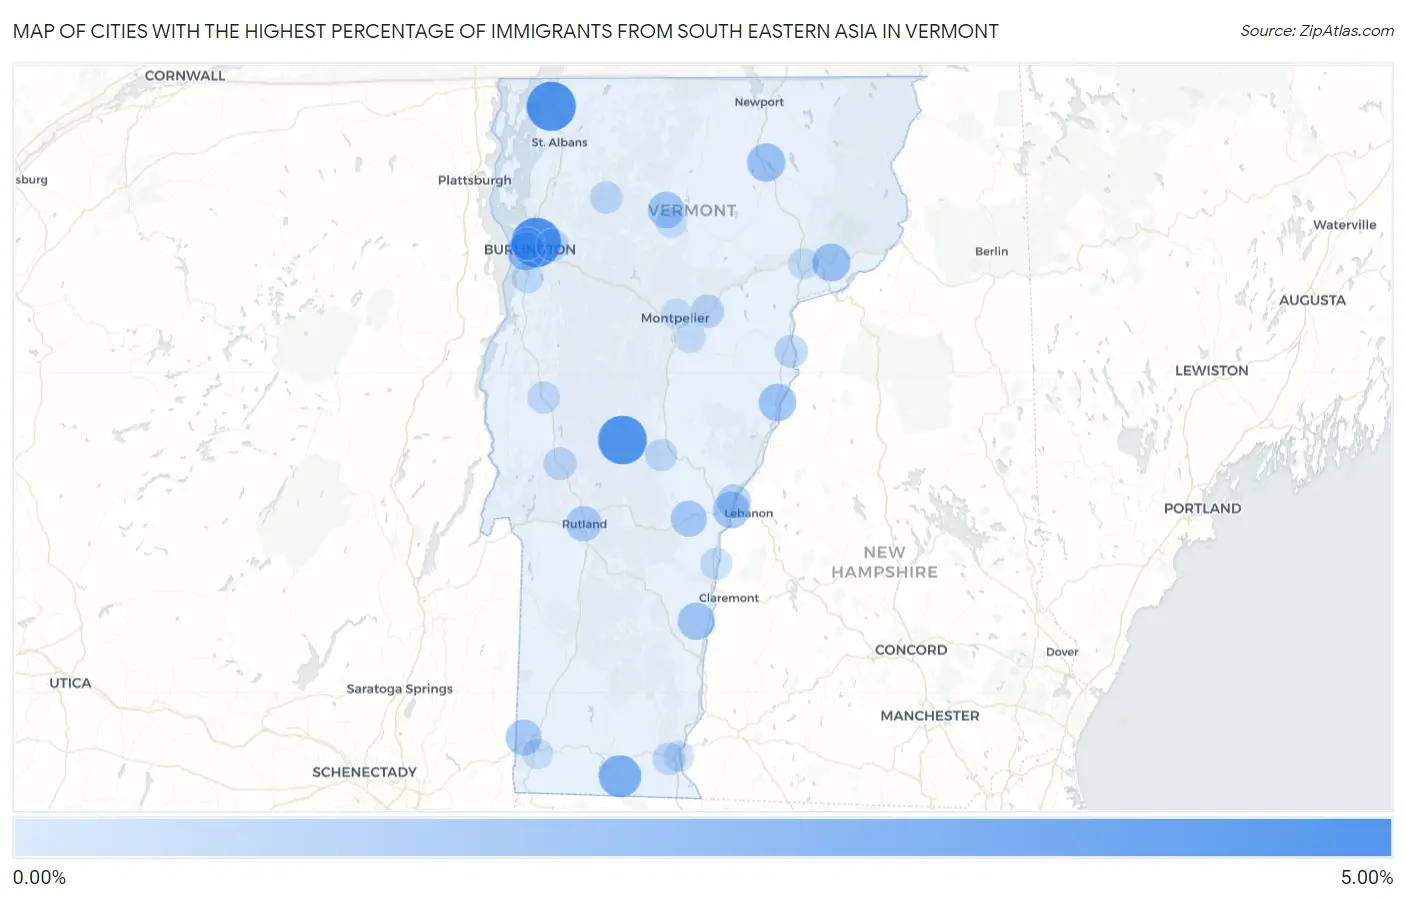
Cities with the Highest Percentage of Immigrants from South Eastern Asia in Vermont
| City | South Eastern Asia | vs State | vs National | |
| 1. | Winooski | 4.24% | 0.37%(+3.86)#-1 | 1.30%(+2.94)#0 |
| 2. | Swanton | 4.16% | 0.37%(+3.79)#0 | 1.30%(+2.86)#1 |
| 3. | Rochester | 4.05% | 0.37%(+3.68)#1 | 1.30%(+2.76)#2 |
| 4. | Killington | 2.99% | 0.37%(+2.62)#2 | 1.30%(+1.70)#3 |
| 5. | Jacksonville | 2.59% | 0.37%(+2.21)#3 | 1.30%(+1.29)#4 |
| 6. | Townshend | 2.35% | 0.37%(+1.98)#4 | 1.30%(+1.06)#5 |
| 7. | Barton | 1.71% | 0.37%(+1.34)#5 | 1.30%(+0.418)#6 |
| 8. | South Burlington | 1.69% | 0.37%(+1.32)#6 | 1.30%(+0.398)#7 |
| 9. | Concord | 1.66% | 0.37%(+1.28)#7 | 1.30%(+0.361)#8 |
| 10. | Bradford | 1.57% | 0.37%(+1.20)#8 | 1.30%(+0.276)#9 |
| 11. | Springfield | 1.47% | 0.37%(+1.10)#9 | 1.30%(+0.174)#10 |
| 12. | White River Junction | 1.41% | 0.37%(+1.04)#10 | 1.30%(+0.114)#11 |
| 13. | Hyde Park | 1.39% | 0.37%(+1.01)#11 | 1.30%(+0.089)#12 |
| 14. | North Bennington | 1.27% | 0.37%(+0.894)#12 | 1.30%(-0.029)#13 |
| 15. | Woodstock | 1.26% | 0.37%(+0.885)#13 | 1.30%(-0.038)#14 |
| 16. | Rutland | 1.12% | 0.37%(+0.746)#14 | 1.30%(-0.177)#15 |
| 17. | Wilder | 0.83% | 0.37%(+0.452)#15 | 1.30%(-0.471)#16 |
| 18. | Plainfield | 0.70% | 0.37%(+0.324)#16 | 1.30%(-0.599)#17 |
| 19. | Wells River | 0.61% | 0.37%(+0.240)#17 | 1.30%(-0.683)#18 |
| 20. | Brandon | 0.59% | 0.37%(+0.219)#18 | 1.30%(-0.704)#19 |
| 21. | Lunenburg | 0.58% | 0.37%(+0.212)#19 | 1.30%(-0.712)#20 |
| 22. | Burlington | 0.57% | 0.37%(+0.200)#20 | 1.30%(-0.723)#21 |
| 23. | Essex Junction | 0.54% | 0.37%(+0.172)#21 | 1.30%(-0.752)#22 |
| 24. | Cambridge | 0.51% | 0.37%(+0.132)#22 | 1.30%(-0.791)#23 |
| 25. | West Brattleboro | 0.50% | 0.37%(+0.124)#23 | 1.30%(-0.799)#24 |
| 26. | Bethel | 0.45% | 0.37%(+0.077)#24 | 1.30%(-0.846)#25 |
| 27. | Middlebury | 0.45% | 0.37%(+0.075)#25 | 1.30%(-0.848)#26 |
| 28. | Windsor | 0.37% | 0.37%(+0.001)#26 | 1.30%(-0.922)#27 |
| 29. | Shelburne | 0.34% | 0.37%(-0.034)#27 | 1.30%(-0.957)#28 |
| 30. | Barre | 0.27% | 0.37%(-0.102)#28 | 1.30%(-1.03)#29 |
| 31. | St Johnsbury | 0.25% | 0.37%(-0.122)#29 | 1.30%(-1.04)#30 |
| 32. | Morrisville | 0.19% | 0.37%(-0.179)#30 | 1.30%(-1.10)#31 |
| 33. | Brattleboro | 0.17% | 0.37%(-0.201)#31 | 1.30%(-1.12)#32 |
| 34. | Bennington | 0.14% | 0.37%(-0.236)#32 | 1.30%(-1.16)#33 |
| 35. | Montpelier | 0.11% | 0.37%(-0.261)#33 | 1.30%(-1.18)#34 |
1
2Common Questions
What are the Top 10 Cities with the Highest Percentage of Immigrants from South Eastern Asia in Vermont?
Top 10 Cities with the Highest Percentage of Immigrants from South Eastern Asia in Vermont are:
#1
4.24%
#2
4.16%
#3
4.05%
#4
2.59%
#5
1.71%
#6
1.69%
#7
1.66%
#8
1.57%
#9
1.47%
#10
1.41%
What city has the Highest Percentage of Immigrants from South Eastern Asia in Vermont?
Winooski has the Highest Percentage of Immigrants from South Eastern Asia in Vermont with 4.24%.
What is the Percentage of Immigrants from South Eastern Asia in the State of Vermont?
Percentage of Immigrants from South Eastern Asia in Vermont is 0.37%.
What is the Percentage of Immigrants from South Eastern Asia in the United States?
Percentage of Immigrants from South Eastern Asia in the United States is 1.30%.