Cities with the Highest Percentage of Immigrants from South Eastern Asia in Ohio
RELATED REPORTS & OPTIONS
South Eastern Asia
Ohio
Compare Cities
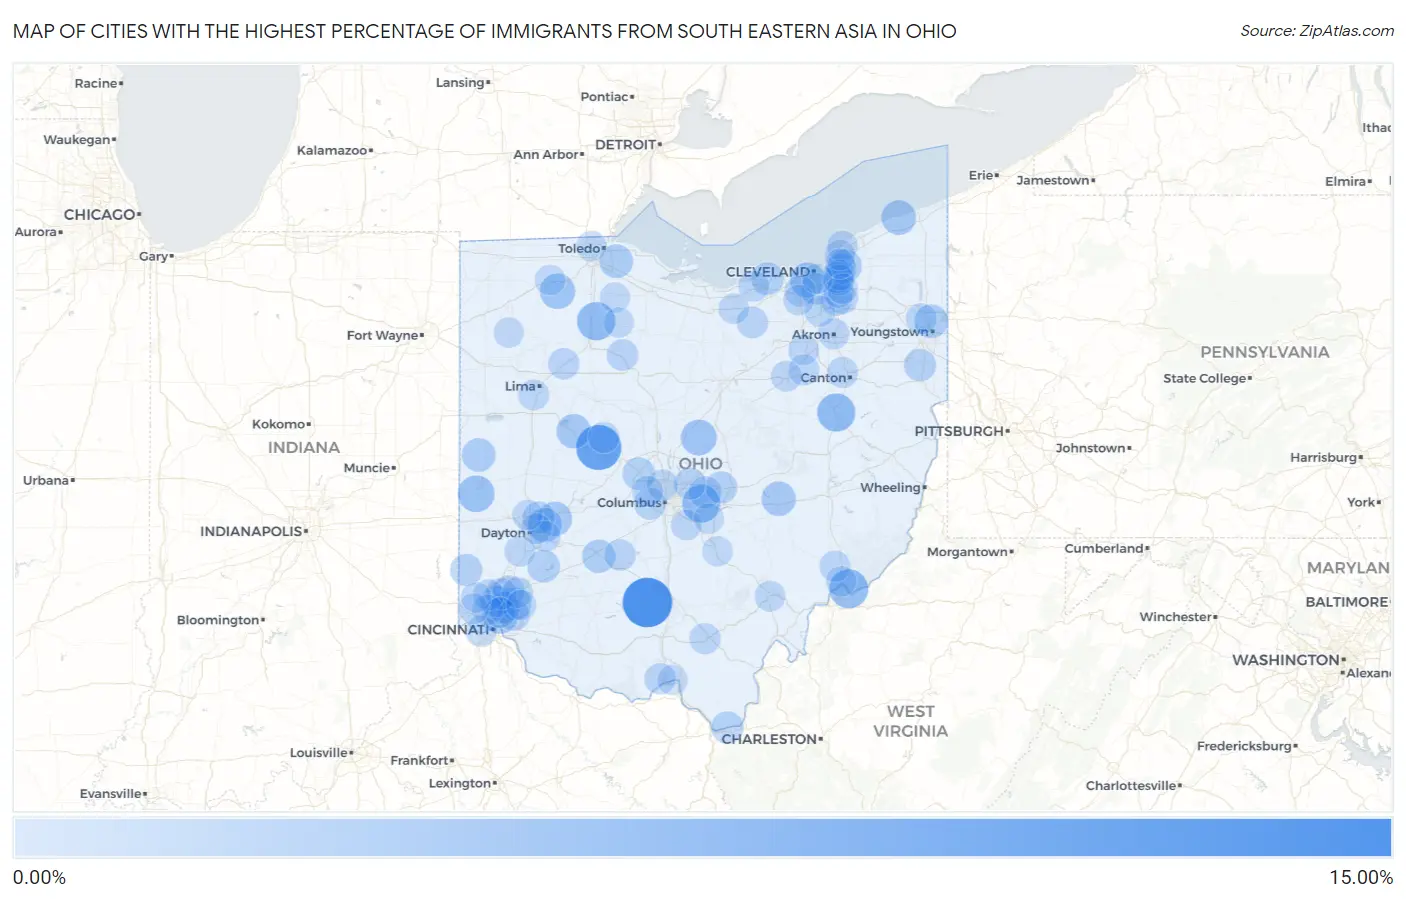
Map of Cities with the Highest Percentage of Immigrants from South Eastern Asia in Ohio
0.00%
15.00%
Cities with the Highest Percentage of Immigrants from South Eastern Asia in Ohio
| City | South Eastern Asia | vs State | vs National | |
| 1. | Bourneville | 10.08% | 0.35%(+9.73)#-1 | 1.30%(+8.78)#0 |
| 2. | East Liberty | 7.92% | 0.35%(+7.57)#0 | 1.30%(+6.62)#1 |
| 3. | Maria Stein | 7.19% | 0.35%(+6.84)#1 | 1.30%(+5.90)#2 |
| 4. | Reno | 4.86% | 0.35%(+4.51)#2 | 1.30%(+3.57)#3 |
| 5. | Bairdstown | 4.59% | 0.35%(+4.24)#3 | 1.30%(+3.29)#4 |
| 6. | Parral | 4.48% | 0.35%(+4.13)#4 | 1.30%(+3.19)#5 |
| 7. | Etna | 4.38% | 0.35%(+4.03)#5 | 1.30%(+3.09)#6 |
| 8. | Guilford Lake | 3.87% | 0.35%(+3.52)#6 | 1.30%(+2.57)#7 |
| 9. | Wayne Lakes | 3.75% | 0.35%(+3.40)#7 | 1.30%(+2.45)#8 |
| 10. | Sullivan | 3.56% | 0.35%(+3.21)#8 | 1.30%(+2.27)#9 |
| 11. | Sparta | 3.43% | 0.35%(+3.08)#9 | 1.30%(+2.13)#10 |
| 12. | Mcclure | 3.17% | 0.35%(+2.82)#10 | 1.30%(+1.88)#11 |
| 13. | Golf Manor | 3.06% | 0.35%(+2.71)#11 | 1.30%(+1.77)#12 |
| 14. | Brooklyn | 2.99% | 0.35%(+2.64)#12 | 1.30%(+1.70)#13 |
| 15. | Geneva On The Lake | 2.86% | 0.35%(+2.51)#13 | 1.30%(+1.56)#14 |
| 16. | North Zanesville | 2.73% | 0.35%(+2.38)#14 | 1.30%(+1.44)#15 |
| 17. | Huntsville | 2.73% | 0.35%(+2.38)#15 | 1.30%(+1.43)#16 |
| 18. | Holiday Valley | 2.64% | 0.35%(+2.29)#16 | 1.30%(+1.34)#17 |
| 19. | Wright Patterson Afb | 2.57% | 0.35%(+2.22)#17 | 1.30%(+1.28)#18 |
| 20. | Sharon Center | 2.42% | 0.35%(+2.07)#18 | 1.30%(+1.12)#19 |
| 21. | Churchill | 2.41% | 0.35%(+2.06)#19 | 1.30%(+1.12)#20 |
| 22. | Millbury | 2.38% | 0.35%(+2.03)#20 | 1.30%(+1.09)#21 |
| 23. | Rossburg | 2.35% | 0.35%(+2.00)#21 | 1.30%(+1.06)#22 |
| 24. | Gates Mills | 2.32% | 0.35%(+1.97)#22 | 1.30%(+1.02)#23 |
| 25. | Milledgeville | 2.25% | 0.35%(+1.90)#23 | 1.30%(+0.951)#24 |
| 26. | Sixteen Mile Stand | 1.99% | 0.35%(+1.63)#24 | 1.30%(+0.689)#25 |
| 27. | Sheffield | 1.89% | 0.35%(+1.54)#25 | 1.30%(+0.597)#26 |
| 28. | New California | 1.89% | 0.35%(+1.54)#26 | 1.30%(+0.589)#27 |
| 29. | Corwin | 1.87% | 0.35%(+1.52)#27 | 1.30%(+0.569)#28 |
| 30. | Beechwood Trails | 1.76% | 0.35%(+1.41)#28 | 1.30%(+0.459)#29 |
| 31. | Leetonia | 1.73% | 0.35%(+1.38)#29 | 1.30%(+0.439)#30 |
| 32. | Chesapeake | 1.72% | 0.35%(+1.37)#30 | 1.30%(+0.423)#31 |
| 33. | Granville | 1.66% | 0.35%(+1.31)#31 | 1.30%(+0.365)#32 |
| 34. | Oxford | 1.66% | 0.35%(+1.31)#32 | 1.30%(+0.363)#33 |
| 35. | Huber Heights | 1.58% | 0.35%(+1.23)#33 | 1.30%(+0.282)#34 |
| 36. | Wetherington | 1.54% | 0.35%(+1.19)#34 | 1.30%(+0.240)#35 |
| 37. | New Albany | 1.53% | 0.35%(+1.18)#35 | 1.30%(+0.235)#36 |
| 38. | Lincoln Village | 1.48% | 0.35%(+1.13)#36 | 1.30%(+0.180)#37 |
| 39. | Evendale | 1.46% | 0.35%(+1.11)#37 | 1.30%(+0.168)#38 |
| 40. | Seven Hills | 1.46% | 0.35%(+1.10)#38 | 1.30%(+0.159)#39 |
| 41. | The Village Of Indian Hill | 1.45% | 0.35%(+1.10)#39 | 1.30%(+0.158)#40 |
| 42. | Springdale | 1.40% | 0.35%(+1.05)#40 | 1.30%(+0.105)#41 |
| 43. | Carey | 1.39% | 0.35%(+1.04)#41 | 1.30%(+0.097)#42 |
| 44. | Bloomingburg | 1.36% | 0.35%(+1.01)#42 | 1.30%(+0.066)#43 |
| 45. | Wellington | 1.36% | 0.35%(+1.01)#43 | 1.30%(+0.063)#44 |
| 46. | Beckett Ridge | 1.28% | 0.35%(+0.925)#44 | 1.30%(-0.021)#45 |
| 47. | Bluffton | 1.27% | 0.35%(+0.921)#45 | 1.30%(-0.025)#46 |
| 48. | West Portsmouth | 1.26% | 0.35%(+0.909)#46 | 1.30%(-0.036)#47 |
| 49. | West Mansfield | 1.25% | 0.35%(+0.897)#47 | 1.30%(-0.049)#48 |
| 50. | Jackson | 1.22% | 0.35%(+0.871)#48 | 1.30%(-0.075)#49 |
| 51. | Macedonia | 1.20% | 0.35%(+0.853)#49 | 1.30%(-0.092)#50 |
| 52. | Delhi Hills | 1.20% | 0.35%(+0.846)#50 | 1.30%(-0.100)#51 |
| 53. | Lowell | 1.19% | 0.35%(+0.835)#51 | 1.30%(-0.111)#52 |
| 54. | Amherst | 1.19% | 0.35%(+0.835)#52 | 1.30%(-0.111)#53 |
| 55. | Hills And Dales | 1.18% | 0.35%(+0.831)#53 | 1.30%(-0.115)#54 |
| 56. | Twinsburg | 1.17% | 0.35%(+0.821)#54 | 1.30%(-0.125)#55 |
| 57. | Woodmere | 1.17% | 0.35%(+0.821)#55 | 1.30%(-0.125)#56 |
| 58. | Riverlea | 1.17% | 0.35%(+0.815)#56 | 1.30%(-0.131)#57 |
| 59. | Akron | 1.16% | 0.35%(+0.806)#57 | 1.30%(-0.140)#372 |
| 60. | Middleburg Heights | 1.12% | 0.35%(+0.774)#58 | 1.30%(-0.172)#373 |
| 61. | Mayfield Heights | 1.12% | 0.35%(+0.767)#59 | 1.30%(-0.178)#374 |
| 62. | Fairfield | 1.12% | 0.35%(+0.766)#60 | 1.30%(-0.180)#375 |
| 63. | Mason | 1.12% | 0.35%(+0.765)#61 | 1.30%(-0.180)#376 |
| 64. | Niles | 1.12% | 0.35%(+0.765)#62 | 1.30%(-0.181)#377 |
| 65. | Richfield | 1.10% | 0.35%(+0.752)#63 | 1.30%(-0.194)#378 |
| 66. | Beavercreek | 1.09% | 0.35%(+0.740)#64 | 1.30%(-0.206)#379 |
| 67. | Wooster | 1.09% | 0.35%(+0.737)#65 | 1.30%(-0.208)#380 |
| 68. | Miamisburg | 1.09% | 0.35%(+0.736)#66 | 1.30%(-0.210)#381 |
| 69. | Fort Shawnee | 1.08% | 0.35%(+0.731)#67 | 1.30%(-0.215)#382 |
| 70. | Hilliard | 1.07% | 0.35%(+0.724)#68 | 1.30%(-0.222)#383 |
| 71. | Orrville | 1.07% | 0.35%(+0.721)#69 | 1.30%(-0.225)#384 |
| 72. | Timberlake | 1.07% | 0.35%(+0.718)#70 | 1.30%(-0.228)#385 |
| 73. | Orange | 1.05% | 0.35%(+0.698)#71 | 1.30%(-0.247)#386 |
| 74. | Riverside | 1.03% | 0.35%(+0.675)#72 | 1.30%(-0.271)#387 |
| 75. | Athens | 1.01% | 0.35%(+0.663)#73 | 1.30%(-0.283)#388 |
| 76. | Skyline Acres | 1.01% | 0.35%(+0.659)#74 | 1.30%(-0.287)#389 |
| 77. | Rittman | 1.01% | 0.35%(+0.656)#75 | 1.30%(-0.289)#390 |
| 78. | Pepper Pike | 1.00% | 0.35%(+0.653)#76 | 1.30%(-0.293)#391 |
| 79. | Strongsville | 1.00% | 0.35%(+0.650)#77 | 1.30%(-0.296)#392 |
| 80. | Lithopolis | 1.00% | 0.35%(+0.649)#78 | 1.30%(-0.296)#393 |
| 81. | Arlington Heights | 0.98% | 0.35%(+0.633)#79 | 1.30%(-0.313)#394 |
| 82. | Taylor Creek | 0.95% | 0.35%(+0.603)#80 | 1.30%(-0.343)#395 |
| 83. | Glenwillow | 0.94% | 0.35%(+0.592)#81 | 1.30%(-0.354)#396 |
| 84. | Wakeman | 0.94% | 0.35%(+0.590)#82 | 1.30%(-0.355)#397 |
| 85. | Liberty Center | 0.92% | 0.35%(+0.567)#83 | 1.30%(-0.379)#398 |
| 86. | Wickliffe | 0.92% | 0.35%(+0.566)#84 | 1.30%(-0.380)#399 |
| 87. | Vandalia | 0.90% | 0.35%(+0.548)#85 | 1.30%(-0.398)#400 |
| 88. | Marietta | 0.89% | 0.35%(+0.540)#86 | 1.30%(-0.406)#401 |
| 89. | Solon | 0.89% | 0.35%(+0.535)#87 | 1.30%(-0.411)#402 |
| 90. | Baltimore | 0.88% | 0.35%(+0.525)#88 | 1.30%(-0.420)#403 |
| 91. | Portsmouth | 0.87% | 0.35%(+0.515)#89 | 1.30%(-0.430)#404 |
| 92. | Bradner | 0.86% | 0.35%(+0.506)#90 | 1.30%(-0.439)#405 |
| 93. | Fostoria | 0.85% | 0.35%(+0.502)#91 | 1.30%(-0.444)#406 |
| 94. | Newburgh Heights | 0.85% | 0.35%(+0.502)#92 | 1.30%(-0.444)#407 |
| 95. | Ross | 0.85% | 0.35%(+0.500)#93 | 1.30%(-0.446)#408 |
| 96. | Sugar Grove | 0.85% | 0.35%(+0.497)#94 | 1.30%(-0.449)#409 |
| 97. | Ottawa Hills | 0.82% | 0.35%(+0.465)#95 | 1.30%(-0.481)#410 |
| 98. | Oakwood | 0.80% | 0.35%(+0.450)#96 | 1.30%(-0.496)#411 |
| 99. | Highland Heights | 0.80% | 0.35%(+0.447)#97 | 1.30%(-0.499)#412 |
| 100. | Loveland | 0.79% | 0.35%(+0.435)#98 | 1.30%(-0.511)#413 |
Common Questions
What are the Top 10 Cities with the Highest Percentage of Immigrants from South Eastern Asia in Ohio?
Top 10 Cities with the Highest Percentage of Immigrants from South Eastern Asia in Ohio are:
#1
10.08%
#2
7.92%
#3
4.86%
#4
4.59%
#5
4.48%
#6
4.38%
#7
3.75%
#8
3.43%
#9
3.17%
#10
3.06%
What city has the Highest Percentage of Immigrants from South Eastern Asia in Ohio?
Bourneville has the Highest Percentage of Immigrants from South Eastern Asia in Ohio with 10.08%.
What is the Percentage of Immigrants from South Eastern Asia in the State of Ohio?
Percentage of Immigrants from South Eastern Asia in Ohio is 0.35%.
What is the Percentage of Immigrants from South Eastern Asia in the United States?
Percentage of Immigrants from South Eastern Asia in the United States is 1.30%.