Zip Codes with the Highest Percentage of Population Employed in Manufacturing in Bremerton, WA

RELATED REPORTS & OPTIONS

Manufacturing
Population
Families and Households
Female Fertility
Female Fertility (Unmarried)
Race (Community Size)
Race (Percentage)
Ancestry (Community Size)
AfricanAleutAmericanApacheArabAustrianBhutaneseBlackfeetBrazilianBritishBurmeseCanadianCentral AmericanCentral American IndianCherokeeChickasawChippewaChoctawCosta RicanCreeCroatianCubanCzechCzechoslovakianDanishDutchEastern EuropeanEnglishEuropeanFinnishFrenchFrench American IndianFrench CanadianGermanGreekGuamanian / ChamorroGuatemalanHonduranHungarianIcelanderIndian (Asian)InupiatIrishIroquoisIsraeliItalianJamaicanKoreanLebaneseLithuanianMexicanMexican American IndianMongolianMoroccanNative HawaiianNavajoNicaraguanNigerianNorthern EuropeanNorwegianOttawaPakistaniPeruvianPolishPortuguesePuerto RicanPuget Sound SalishRomanianRussianSalvadoranSamoanScandinavianScotch-IrishScottishSerbianSiouxSlavicSlovakSouth AmericanSpaniardSpanishSri LankanSubsaharan AfricanSwedishSwissThaiTlingit-HaidaTurkishUkrainianWelshYaquiYugoslavian
Ancestry (Percentage)
AfricanAleutAmericanApacheArabAustrianBhutaneseBlackfeetBrazilianBritishBurmeseCanadianCentral AmericanCentral American IndianCherokeeChickasawChippewaChoctawCosta RicanCreeCroatianCubanCzechCzechoslovakianDanishDutchEastern EuropeanEnglishEuropeanFinnishFrenchFrench American IndianFrench CanadianGermanGreekGuamanian / ChamorroGuatemalanHonduranHungarianIcelanderIndian (Asian)InupiatIrishIroquoisIsraeliItalianJamaicanKoreanLebaneseLithuanianMexicanMexican American IndianMongolianMoroccanNative HawaiianNavajoNicaraguanNigerianNorthern EuropeanNorwegianOttawaPakistaniPeruvianPolishPortuguesePuerto RicanPuget Sound SalishRomanianRussianSalvadoranSamoanScandinavianScotch-IrishScottishSerbianSiouxSlavicSlovakSouth AmericanSpaniardSpanishSri LankanSubsaharan AfricanSwedishSwissThaiTlingit-HaidaTurkishUkrainianWelshYaquiYugoslavian
Immigrant Origin (Total)
Immigrant Origin (Percentage)
Income
Income (Families)
Income (Households)
Poverty
Poverty (Families)
Unemployment
Employment Occupations
Employment Industries
Employer Class
Commute Time
Commute Means
School Enrollment
Education by Degree Field
Occupancy
Finances
Physical Characteristics
Bremerton
Compare Zip Codes
Comparison Subject

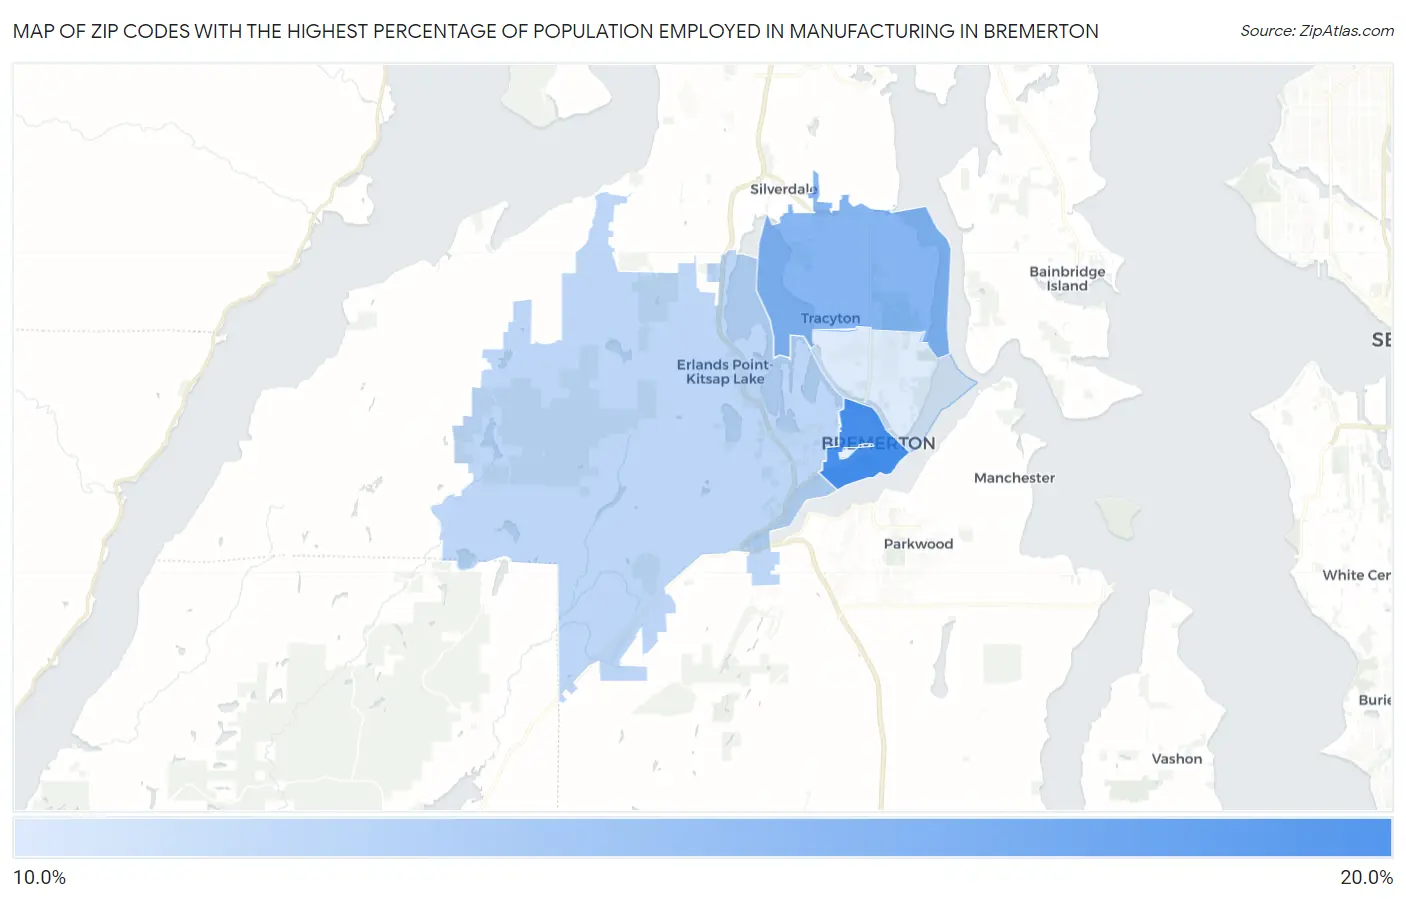
Map of Zip Codes with the Highest Percentage of Population Employed in Manufacturing in Bremerton

0.0%
20.0%
Zip Codes with the Highest Percentage of Population Employed in Manufacturing in Bremerton Map

Zip Codes with the Highest Percentage of Population Employed in Manufacturing in Bremerton, WA

Zip Code % Employed vs State vs National
1.9833717.1%9.2%(+7.82)#4110.0%(+7.06)#7,079
2.9831114.8%9.2%(+5.57)#6710.0%(+4.81)#9,279
3.9831212.8%9.2%(+3.55)#10110.0%(+2.79)#11,651
4.9831011.7%9.2%(+2.44)#12910.0%(+1.68)#13,154

Common Questions

What are the Top 3 Zip Codes with the Highest Percentage of Population Employed in Manufacturing in Bremerton, WA?
Top 3 Zip Codes with the Highest Percentage of Population Employed in Manufacturing in Bremerton, WA are:
#1
17.1%
#2
14.8%
#3
12.8%
What zip code has the Highest Percentage of Population Employed in Manufacturing in Bremerton, WA?
98337 has the Highest Percentage of Population Employed in Manufacturing in Bremerton, WA with 17.1%.
What is the Percentage of Population Employed in Manufacturing in Bremerton, WA?
Percentage of Population Employed in Manufacturing in Bremerton is 11.9%.
What is the Percentage of Population Employed in Manufacturing in Washington?
Percentage of Population Employed in Manufacturing in Washington is 9.2%.
What is the Percentage of Population Employed in Manufacturing in the United States?
Percentage of Population Employed in Manufacturing in the United States is 10.0%.