Zip Codes with the Highest Percentage of Population Employed in Construction & Extraction in Richland, WA
RELATED REPORTS & OPTIONS
Construction & Extraction
Richland
Compare Zip Codes
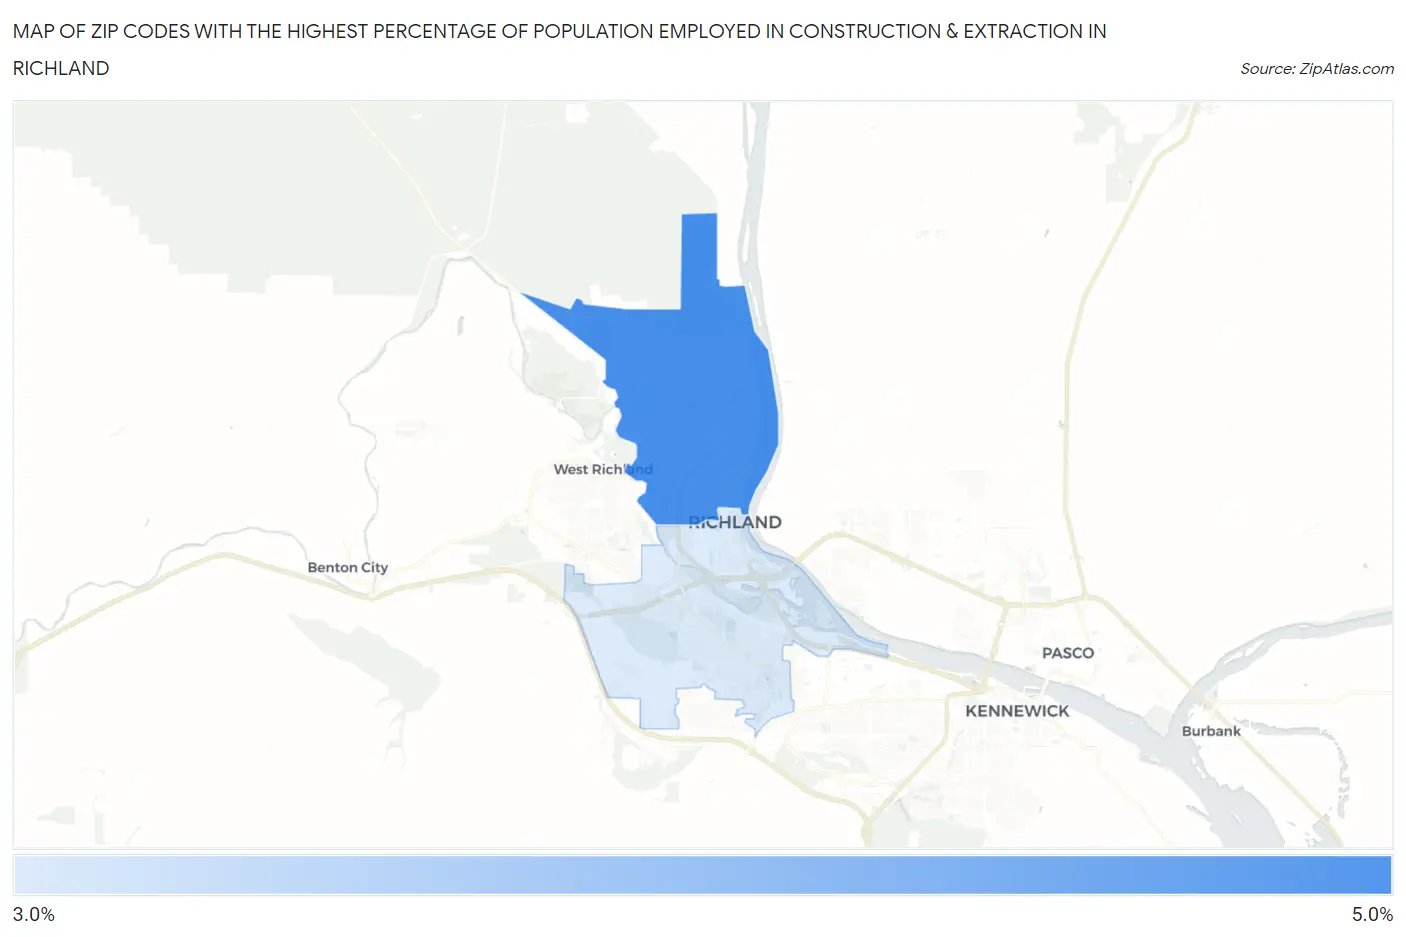
Map of Zip Codes with the Highest Percentage of Population Employed in Construction & Extraction in Richland
3.4%
5.0%
Zip Codes with the Highest Percentage of Population Employed in Construction & Extraction in Richland, WA
| Zip Code | % Employed | vs State | vs National | |
| 1. | 99354 | 5.0% | 4.9%(+0.065)#291 | 5.0%(-0.012)#16,819 |
| 2. | 99352 | 3.4% | 4.9%(-1.55)#389 | 5.0%(-1.62)#22,423 |
1
Common Questions
What are the Top Zip Codes with the Highest Percentage of Population Employed in Construction & Extraction in Richland, WA?
Top Zip Codes with the Highest Percentage of Population Employed in Construction & Extraction in Richland, WA are:
What zip code has the Highest Percentage of Population Employed in Construction & Extraction in Richland, WA?
99354 has the Highest Percentage of Population Employed in Construction & Extraction in Richland, WA with 5.0%.
What is the Percentage of Population Employed in Construction & Extraction in Richland, WA?
Percentage of Population Employed in Construction & Extraction in Richland is 4.1%.
What is the Percentage of Population Employed in Construction & Extraction in Washington?
Percentage of Population Employed in Construction & Extraction in Washington is 4.9%.
What is the Percentage of Population Employed in Construction & Extraction in the United States?
Percentage of Population Employed in Construction & Extraction in the United States is 5.0%.