Cities with the Largest Welsh Community in Illinois
RELATED REPORTS & OPTIONS
Welsh
Illinois
Compare Cities
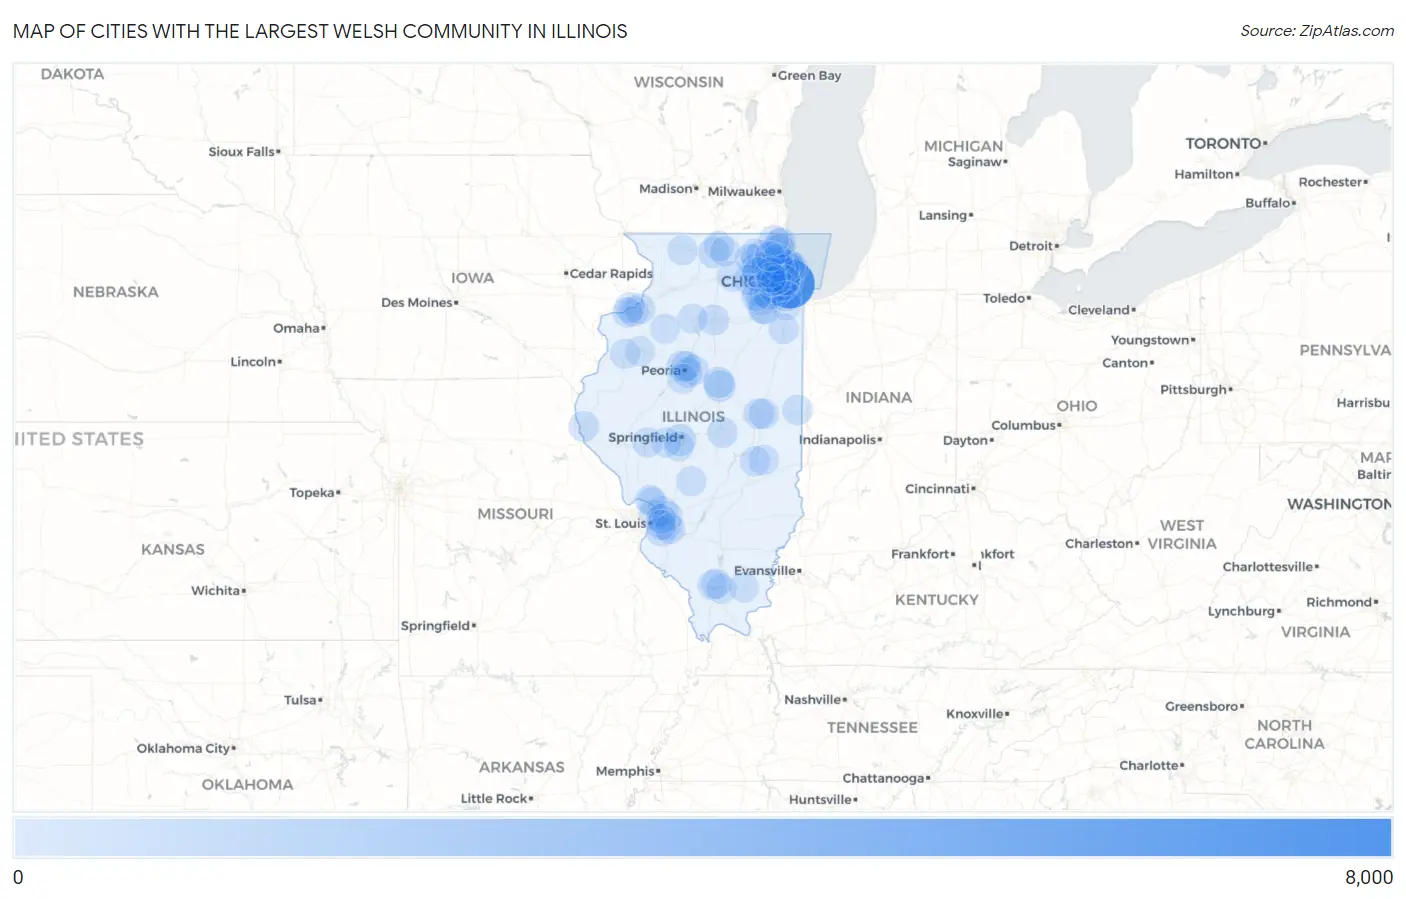
Map of Cities with the Largest Welsh Community in Illinois
0
8,000
Cities with the Largest Welsh Community in Illinois
| City | Welsh | vs State | vs National | |
| 1. | Chicago | 6,791 | 45,769(14.84%)#1 | 1,736,338(0.39%)#5 |
| 2. | Naperville | 914 | 45,769(2.00%)#2 | 1,736,338(0.05%)#169 |
| 3. | Springfield | 671 | 45,769(1.47%)#3 | 1,736,338(0.04%)#259 |
| 4. | Peoria | 588 | 45,769(1.28%)#4 | 1,736,338(0.03%)#306 |
| 5. | Bloomington | 505 | 45,769(1.10%)#5 | 1,736,338(0.03%)#392 |
| 6. | Rockford | 470 | 45,769(1.03%)#6 | 1,736,338(0.03%)#437 |
| 7. | Aurora | 453 | 45,769(0.99%)#7 | 1,736,338(0.03%)#462 |
| 8. | Joliet | 437 | 45,769(0.95%)#8 | 1,736,338(0.03%)#488 |
| 9. | Normal | 420 | 45,769(0.92%)#9 | 1,736,338(0.02%)#512 |
| 10. | Oak Park | 393 | 45,769(0.86%)#10 | 1,736,338(0.02%)#573 |
| 11. | Evanston | 380 | 45,769(0.83%)#11 | 1,736,338(0.02%)#601 |
| 12. | Plainfield | 364 | 45,769(0.80%)#12 | 1,736,338(0.02%)#639 |
| 13. | O Fallon | 335 | 45,769(0.73%)#13 | 1,736,338(0.02%)#705 |
| 14. | Champaign | 333 | 45,769(0.73%)#14 | 1,736,338(0.02%)#708 |
| 15. | Lasalle | 331 | 45,769(0.72%)#15 | 1,736,338(0.02%)#716 |
| 16. | Wheaton | 318 | 45,769(0.69%)#16 | 1,736,338(0.02%)#752 |
| 17. | Elmhurst | 318 | 45,769(0.69%)#17 | 1,736,338(0.02%)#753 |
| 18. | Downers Grove | 286 | 45,769(0.62%)#18 | 1,736,338(0.02%)#858 |
| 19. | Elgin | 285 | 45,769(0.62%)#19 | 1,736,338(0.02%)#859 |
| 20. | Decatur | 266 | 45,769(0.58%)#20 | 1,736,338(0.02%)#932 |
| 21. | Skokie | 258 | 45,769(0.56%)#21 | 1,736,338(0.01%)#965 |
| 22. | Bartlett | 256 | 45,769(0.56%)#22 | 1,736,338(0.01%)#973 |
| 23. | Quincy | 256 | 45,769(0.56%)#23 | 1,736,338(0.01%)#974 |
| 24. | East Moline | 225 | 45,769(0.49%)#24 | 1,736,338(0.01%)#1,141 |
| 25. | Manteno | 225 | 45,769(0.49%)#25 | 1,736,338(0.01%)#1,143 |
| 26. | Palatine | 222 | 45,769(0.49%)#26 | 1,736,338(0.01%)#1,158 |
| 27. | Danville | 222 | 45,769(0.49%)#27 | 1,736,338(0.01%)#1,161 |
| 28. | Northfield | 209 | 45,769(0.46%)#28 | 1,736,338(0.01%)#1,230 |
| 29. | Schaumburg | 208 | 45,769(0.45%)#29 | 1,736,338(0.01%)#1,232 |
| 30. | Jacksonville | 207 | 45,769(0.45%)#30 | 1,736,338(0.01%)#1,240 |
| 31. | Washington | 207 | 45,769(0.45%)#31 | 1,736,338(0.01%)#1,241 |
| 32. | Edwardsville | 204 | 45,769(0.45%)#32 | 1,736,338(0.01%)#1,262 |
| 33. | Moline | 194 | 45,769(0.42%)#33 | 1,736,338(0.01%)#1,336 |
| 34. | Urbana | 194 | 45,769(0.42%)#34 | 1,736,338(0.01%)#1,337 |
| 35. | Troy | 191 | 45,769(0.42%)#35 | 1,736,338(0.01%)#1,359 |
| 36. | Charleston | 189 | 45,769(0.41%)#36 | 1,736,338(0.01%)#1,365 |
| 37. | Arlington Heights | 187 | 45,769(0.41%)#37 | 1,736,338(0.01%)#1,378 |
| 38. | Granite City | 183 | 45,769(0.40%)#38 | 1,736,338(0.01%)#1,409 |
| 39. | Dekalb | 182 | 45,769(0.40%)#39 | 1,736,338(0.01%)#1,418 |
| 40. | Belleville | 178 | 45,769(0.39%)#40 | 1,736,338(0.01%)#1,455 |
| 41. | Rock Island Arsenal | 178 | 45,769(0.39%)#41 | 1,736,338(0.01%)#1,465 |
| 42. | East Peoria | 176 | 45,769(0.38%)#42 | 1,736,338(0.01%)#1,479 |
| 43. | Mattoon | 176 | 45,769(0.38%)#43 | 1,736,338(0.01%)#1,482 |
| 44. | Crystal Lake | 174 | 45,769(0.38%)#44 | 1,736,338(0.01%)#1,503 |
| 45. | Glenview | 172 | 45,769(0.38%)#45 | 1,736,338(0.01%)#1,527 |
| 46. | Brookfield | 171 | 45,769(0.37%)#46 | 1,736,338(0.01%)#1,539 |
| 47. | Darien | 168 | 45,769(0.37%)#47 | 1,736,338(0.01%)#1,570 |
| 48. | Carterville | 168 | 45,769(0.37%)#48 | 1,736,338(0.01%)#1,573 |
| 49. | Scott Afb | 167 | 45,769(0.36%)#49 | 1,736,338(0.01%)#1,585 |
| 50. | Freeport | 163 | 45,769(0.36%)#50 | 1,736,338(0.01%)#1,618 |
| 51. | St Charles | 162 | 45,769(0.35%)#51 | 1,736,338(0.01%)#1,627 |
| 52. | Algonquin | 157 | 45,769(0.34%)#52 | 1,736,338(0.01%)#1,684 |
| 53. | Rock Island | 155 | 45,769(0.34%)#53 | 1,736,338(0.01%)#1,704 |
| 54. | Gurnee | 154 | 45,769(0.34%)#54 | 1,736,338(0.01%)#1,724 |
| 55. | Forest Park | 154 | 45,769(0.34%)#55 | 1,736,338(0.01%)#1,729 |
| 56. | Peoria Heights | 153 | 45,769(0.33%)#56 | 1,736,338(0.01%)#1,743 |
| 57. | Alton | 147 | 45,769(0.32%)#57 | 1,736,338(0.01%)#1,826 |
| 58. | Wilmette | 144 | 45,769(0.31%)#58 | 1,736,338(0.01%)#1,870 |
| 59. | Cary | 142 | 45,769(0.31%)#59 | 1,736,338(0.01%)#1,912 |
| 60. | Hillsboro | 140 | 45,769(0.31%)#60 | 1,736,338(0.01%)#1,948 |
| 61. | Marion | 139 | 45,769(0.30%)#61 | 1,736,338(0.01%)#1,953 |
| 62. | Tinley Park | 136 | 45,769(0.30%)#62 | 1,736,338(0.01%)#1,992 |
| 63. | Lombard | 131 | 45,769(0.29%)#63 | 1,736,338(0.01%)#2,050 |
| 64. | Princeton | 130 | 45,769(0.28%)#64 | 1,736,338(0.01%)#2,073 |
| 65. | Des Plaines | 127 | 45,769(0.28%)#65 | 1,736,338(0.01%)#2,101 |
| 66. | Herrin | 127 | 45,769(0.28%)#66 | 1,736,338(0.01%)#2,106 |
| 67. | Mount Prospect | 124 | 45,769(0.27%)#67 | 1,736,338(0.01%)#2,138 |
| 68. | Libertyville | 124 | 45,769(0.27%)#68 | 1,736,338(0.01%)#2,145 |
| 69. | Elburn | 123 | 45,769(0.27%)#69 | 1,736,338(0.01%)#2,167 |
| 70. | Hoffman Estates | 120 | 45,769(0.26%)#70 | 1,736,338(0.01%)#2,209 |
| 71. | Chatham | 120 | 45,769(0.26%)#71 | 1,736,338(0.01%)#2,214 |
| 72. | Park Ridge | 118 | 45,769(0.26%)#72 | 1,736,338(0.01%)#2,235 |
| 73. | Galesburg | 116 | 45,769(0.25%)#73 | 1,736,338(0.01%)#2,267 |
| 74. | Bolingbrook | 115 | 45,769(0.25%)#74 | 1,736,338(0.01%)#2,283 |
| 75. | Shorewood | 114 | 45,769(0.25%)#75 | 1,736,338(0.01%)#2,314 |
| 76. | Oswego | 112 | 45,769(0.24%)#76 | 1,736,338(0.01%)#2,351 |
| 77. | Huntley | 112 | 45,769(0.24%)#77 | 1,736,338(0.01%)#2,353 |
| 78. | Loves Park | 111 | 45,769(0.24%)#78 | 1,736,338(0.01%)#2,379 |
| 79. | Godfrey | 111 | 45,769(0.24%)#79 | 1,736,338(0.01%)#2,382 |
| 80. | Green Oaks | 109 | 45,769(0.24%)#80 | 1,736,338(0.01%)#2,417 |
| 81. | Waukegan | 108 | 45,769(0.24%)#81 | 1,736,338(0.01%)#2,418 |
| 82. | Harrisburg | 108 | 45,769(0.24%)#82 | 1,736,338(0.01%)#2,436 |
| 83. | Western Springs | 107 | 45,769(0.23%)#83 | 1,736,338(0.01%)#2,450 |
| 84. | Buffalo Grove | 106 | 45,769(0.23%)#84 | 1,736,338(0.01%)#2,460 |
| 85. | Pekin | 106 | 45,769(0.23%)#85 | 1,736,338(0.01%)#2,463 |
| 86. | South Elgin | 104 | 45,769(0.23%)#86 | 1,736,338(0.01%)#2,501 |
| 87. | Lindenhurst | 103 | 45,769(0.23%)#87 | 1,736,338(0.01%)#2,533 |
| 88. | Collinsville | 102 | 45,769(0.22%)#88 | 1,736,338(0.01%)#2,557 |
| 89. | River Forest | 101 | 45,769(0.22%)#89 | 1,736,338(0.01%)#2,583 |
| 90. | Glen Ellyn | 99 | 45,769(0.22%)#90 | 1,736,338(0.01%)#2,624 |
| 91. | Fairview Heights | 99 | 45,769(0.22%)#91 | 1,736,338(0.01%)#2,630 |
| 92. | Palos Heights | 99 | 45,769(0.22%)#92 | 1,736,338(0.01%)#2,633 |
| 93. | New Berlin | 99 | 45,769(0.22%)#93 | 1,736,338(0.01%)#2,651 |
| 94. | Roselle | 95 | 45,769(0.21%)#94 | 1,736,338(0.01%)#2,714 |
| 95. | Kewanee | 95 | 45,769(0.21%)#95 | 1,736,338(0.01%)#2,721 |
| 96. | Belvidere | 93 | 45,769(0.20%)#96 | 1,736,338(0.01%)#2,760 |
| 97. | Monmouth | 93 | 45,769(0.20%)#97 | 1,736,338(0.01%)#2,769 |
| 98. | Villa Park | 92 | 45,769(0.20%)#98 | 1,736,338(0.01%)#2,780 |
| 99. | Glendale Heights | 88 | 45,769(0.19%)#99 | 1,736,338(0.01%)#2,887 |
| 100. | Lake Zurich | 88 | 45,769(0.19%)#100 | 1,736,338(0.01%)#2,888 |
Common Questions
What are the Top 10 Cities with the Largest Welsh Community in Illinois?
Top 10 Cities with the Largest Welsh Community in Illinois are:
#1
6,791
#2
914
#3
671
#4
588
#5
505
#6
470
#7
453
#8
437
#9
420
#10
393
What city has the Largest Welsh Community in Illinois?
Chicago has the Largest Welsh Community in Illinois with 6,791.
What is the Total Welsh Population in the State of Illinois?
Total Welsh Population in Illinois is 45,769.
What is the Total Welsh Population in the United States?
Total Welsh Population in the United States is 1,736,338.