Cities with the Largest Welsh Community in Ohio
RELATED REPORTS & OPTIONS
Welsh
Ohio
Compare Cities
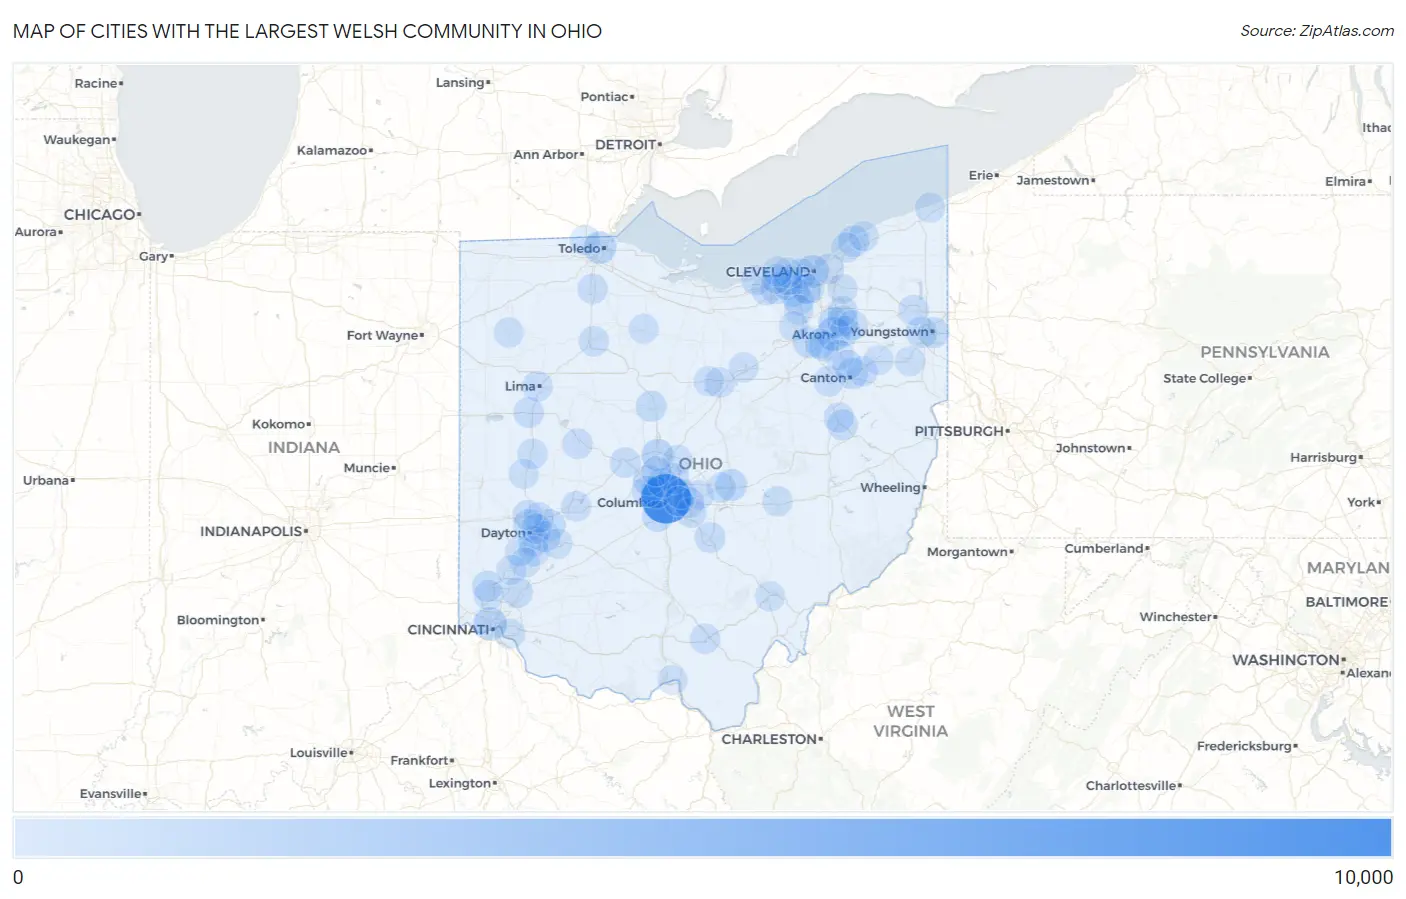
Map of Cities with the Largest Welsh Community in Ohio
0
10,000
Cities with the Largest Welsh Community in Ohio
| City | Welsh | vs State | vs National | |
| 1. | Columbus | 9,527 | 110,680(8.61%)#1 | 1,736,338(0.55%)#2 |
| 2. | Akron | 1,822 | 110,680(1.65%)#2 | 1,736,338(0.10%)#58 |
| 3. | Cincinnati | 1,553 | 110,680(1.40%)#3 | 1,736,338(0.09%)#77 |
| 4. | Cleveland | 1,320 | 110,680(1.19%)#4 | 1,736,338(0.08%)#96 |
| 5. | Toledo | 1,226 | 110,680(1.11%)#5 | 1,736,338(0.07%)#107 |
| 6. | Delaware | 1,058 | 110,680(0.96%)#6 | 1,736,338(0.06%)#134 |
| 7. | Upper Arlington | 997 | 110,680(0.90%)#7 | 1,736,338(0.06%)#148 |
| 8. | Newark | 983 | 110,680(0.89%)#8 | 1,736,338(0.06%)#152 |
| 9. | Mentor | 867 | 110,680(0.78%)#9 | 1,736,338(0.05%)#185 |
| 10. | Wadsworth | 743 | 110,680(0.67%)#10 | 1,736,338(0.04%)#228 |
| 11. | Dayton | 719 | 110,680(0.65%)#11 | 1,736,338(0.04%)#234 |
| 12. | Grove City | 670 | 110,680(0.61%)#12 | 1,736,338(0.04%)#260 |
| 13. | Canton | 662 | 110,680(0.60%)#13 | 1,736,338(0.04%)#267 |
| 14. | Austintown | 651 | 110,680(0.59%)#14 | 1,736,338(0.04%)#268 |
| 15. | Dublin | 623 | 110,680(0.56%)#15 | 1,736,338(0.04%)#285 |
| 16. | Hilliard | 623 | 110,680(0.56%)#16 | 1,736,338(0.04%)#286 |
| 17. | Marion | 602 | 110,680(0.54%)#17 | 1,736,338(0.03%)#298 |
| 18. | Fairborn | 578 | 110,680(0.52%)#18 | 1,736,338(0.03%)#312 |
| 19. | Hamilton | 568 | 110,680(0.51%)#19 | 1,736,338(0.03%)#322 |
| 20. | North Ridgeville | 562 | 110,680(0.51%)#20 | 1,736,338(0.03%)#329 |
| 21. | Westerville | 560 | 110,680(0.51%)#21 | 1,736,338(0.03%)#334 |
| 22. | Parma | 551 | 110,680(0.50%)#22 | 1,736,338(0.03%)#341 |
| 23. | Youngstown | 544 | 110,680(0.49%)#23 | 1,736,338(0.03%)#352 |
| 24. | Lancaster | 524 | 110,680(0.47%)#24 | 1,736,338(0.03%)#377 |
| 25. | Stow | 481 | 110,680(0.43%)#25 | 1,736,338(0.03%)#420 |
| 26. | Cuyahoga Falls | 477 | 110,680(0.43%)#26 | 1,736,338(0.03%)#422 |
| 27. | Berea | 475 | 110,680(0.43%)#27 | 1,736,338(0.03%)#430 |
| 28. | Beavercreek | 467 | 110,680(0.42%)#28 | 1,736,338(0.03%)#442 |
| 29. | Mason | 458 | 110,680(0.41%)#29 | 1,736,338(0.03%)#455 |
| 30. | Kettering | 456 | 110,680(0.41%)#30 | 1,736,338(0.03%)#457 |
| 31. | Strongsville | 451 | 110,680(0.41%)#31 | 1,736,338(0.03%)#467 |
| 32. | New Philadelphia | 449 | 110,680(0.41%)#32 | 1,736,338(0.03%)#472 |
| 33. | Marysville | 418 | 110,680(0.38%)#33 | 1,736,338(0.02%)#517 |
| 34. | Wapakoneta | 413 | 110,680(0.37%)#34 | 1,736,338(0.02%)#527 |
| 35. | Reynoldsburg | 384 | 110,680(0.35%)#35 | 1,736,338(0.02%)#591 |
| 36. | Massillon | 383 | 110,680(0.35%)#36 | 1,736,338(0.02%)#594 |
| 37. | Barberton | 381 | 110,680(0.34%)#37 | 1,736,338(0.02%)#599 |
| 38. | Bellefontaine | 377 | 110,680(0.34%)#38 | 1,736,338(0.02%)#612 |
| 39. | Lakewood | 374 | 110,680(0.34%)#39 | 1,736,338(0.02%)#618 |
| 40. | Pickerington | 370 | 110,680(0.33%)#40 | 1,736,338(0.02%)#626 |
| 41. | Cleveland Heights | 357 | 110,680(0.32%)#41 | 1,736,338(0.02%)#652 |
| 42. | Lima | 351 | 110,680(0.32%)#42 | 1,736,338(0.02%)#667 |
| 43. | Springfield | 345 | 110,680(0.31%)#43 | 1,736,338(0.02%)#682 |
| 44. | Findlay | 344 | 110,680(0.31%)#44 | 1,736,338(0.02%)#688 |
| 45. | Lorain | 343 | 110,680(0.31%)#45 | 1,736,338(0.02%)#689 |
| 46. | Centerville | 340 | 110,680(0.31%)#46 | 1,736,338(0.02%)#698 |
| 47. | Jackson | 330 | 110,680(0.30%)#47 | 1,736,338(0.02%)#722 |
| 48. | Huber Heights | 328 | 110,680(0.30%)#48 | 1,736,338(0.02%)#726 |
| 49. | Warren | 326 | 110,680(0.29%)#49 | 1,736,338(0.02%)#730 |
| 50. | Elyria | 320 | 110,680(0.29%)#50 | 1,736,338(0.02%)#749 |
| 51. | Mansfield | 314 | 110,680(0.28%)#51 | 1,736,338(0.02%)#765 |
| 52. | Tallmadge | 314 | 110,680(0.28%)#52 | 1,736,338(0.02%)#768 |
| 53. | Bowling Green | 310 | 110,680(0.28%)#53 | 1,736,338(0.02%)#778 |
| 54. | North Olmsted | 306 | 110,680(0.28%)#54 | 1,736,338(0.02%)#790 |
| 55. | Louisville | 305 | 110,680(0.28%)#55 | 1,736,338(0.02%)#796 |
| 56. | Riverside | 300 | 110,680(0.27%)#56 | 1,736,338(0.02%)#815 |
| 57. | Hudson | 287 | 110,680(0.26%)#57 | 1,736,338(0.02%)#857 |
| 58. | Westlake | 269 | 110,680(0.24%)#58 | 1,736,338(0.02%)#927 |
| 59. | Zanesville | 263 | 110,680(0.24%)#59 | 1,736,338(0.02%)#943 |
| 60. | Dover | 260 | 110,680(0.23%)#60 | 1,736,338(0.01%)#958 |
| 61. | Sidney | 254 | 110,680(0.23%)#61 | 1,736,338(0.01%)#987 |
| 62. | Alliance | 249 | 110,680(0.22%)#62 | 1,736,338(0.01%)#1,012 |
| 63. | Green | 248 | 110,680(0.22%)#63 | 1,736,338(0.01%)#1,014 |
| 64. | Miamisburg | 246 | 110,680(0.22%)#64 | 1,736,338(0.01%)#1,024 |
| 65. | Ontario | 242 | 110,680(0.22%)#65 | 1,736,338(0.01%)#1,051 |
| 66. | Gahanna | 239 | 110,680(0.22%)#66 | 1,736,338(0.01%)#1,062 |
| 67. | Willoughby | 237 | 110,680(0.21%)#67 | 1,736,338(0.01%)#1,067 |
| 68. | Norton | 237 | 110,680(0.21%)#68 | 1,736,338(0.01%)#1,069 |
| 69. | North Canton | 235 | 110,680(0.21%)#69 | 1,736,338(0.01%)#1,085 |
| 70. | Sunbury | 229 | 110,680(0.21%)#70 | 1,736,338(0.01%)#1,117 |
| 71. | Parma Heights | 226 | 110,680(0.20%)#71 | 1,736,338(0.01%)#1,133 |
| 72. | Fruit Hill | 222 | 110,680(0.20%)#72 | 1,736,338(0.01%)#1,167 |
| 73. | Athens | 220 | 110,680(0.20%)#73 | 1,736,338(0.01%)#1,173 |
| 74. | Bay Village | 220 | 110,680(0.20%)#74 | 1,736,338(0.01%)#1,176 |
| 75. | Springboro | 215 | 110,680(0.19%)#75 | 1,736,338(0.01%)#1,203 |
| 76. | Xenia | 214 | 110,680(0.19%)#76 | 1,736,338(0.01%)#1,206 |
| 77. | Pataskala | 213 | 110,680(0.19%)#77 | 1,736,338(0.01%)#1,215 |
| 78. | Oakwood | 209 | 110,680(0.19%)#78 | 1,736,338(0.01%)#1,229 |
| 79. | Worthington | 206 | 110,680(0.19%)#79 | 1,736,338(0.01%)#1,247 |
| 80. | Avon Lake | 202 | 110,680(0.18%)#80 | 1,736,338(0.01%)#1,275 |
| 81. | Powell | 197 | 110,680(0.18%)#81 | 1,736,338(0.01%)#1,313 |
| 82. | North Kingsville | 196 | 110,680(0.18%)#82 | 1,736,338(0.01%)#1,324 |
| 83. | Sylvania | 194 | 110,680(0.18%)#83 | 1,736,338(0.01%)#1,340 |
| 84. | Portsmouth | 194 | 110,680(0.18%)#84 | 1,736,338(0.01%)#1,341 |
| 85. | Painesville | 190 | 110,680(0.17%)#85 | 1,736,338(0.01%)#1,363 |
| 86. | Granville | 190 | 110,680(0.17%)#86 | 1,736,338(0.01%)#1,364 |
| 87. | Fairfield | 188 | 110,680(0.17%)#87 | 1,736,338(0.01%)#1,373 |
| 88. | Salem | 187 | 110,680(0.17%)#88 | 1,736,338(0.01%)#1,387 |
| 89. | Wilkshire Hills | 187 | 110,680(0.17%)#89 | 1,736,338(0.01%)#1,388 |
| 90. | Tiffin | 181 | 110,680(0.16%)#90 | 1,736,338(0.01%)#1,429 |
| 91. | Whitehall | 180 | 110,680(0.16%)#91 | 1,736,338(0.01%)#1,439 |
| 92. | Kent | 179 | 110,680(0.16%)#92 | 1,736,338(0.01%)#1,450 |
| 93. | Avon | 178 | 110,680(0.16%)#93 | 1,736,338(0.01%)#1,458 |
| 94. | Vandalia | 178 | 110,680(0.16%)#94 | 1,736,338(0.01%)#1,461 |
| 95. | Brunswick | 177 | 110,680(0.16%)#95 | 1,736,338(0.01%)#1,470 |
| 96. | Middletown | 176 | 110,680(0.16%)#96 | 1,736,338(0.01%)#1,476 |
| 97. | Solon | 176 | 110,680(0.16%)#97 | 1,736,338(0.01%)#1,478 |
| 98. | Ashland | 175 | 110,680(0.16%)#98 | 1,736,338(0.01%)#1,498 |
| 99. | Medina | 174 | 110,680(0.16%)#99 | 1,736,338(0.01%)#1,507 |
| 100. | Piqua | 174 | 110,680(0.16%)#100 | 1,736,338(0.01%)#1,510 |
Common Questions
What are the Top 10 Cities with the Largest Welsh Community in Ohio?
Top 10 Cities with the Largest Welsh Community in Ohio are:
#1
9,527
#2
1,822
#3
1,553
#4
1,320
#5
1,226
#6
1,058
#7
997
#8
983
#9
867
#10
743
What city has the Largest Welsh Community in Ohio?
Columbus has the Largest Welsh Community in Ohio with 9,527.
What is the Total Welsh Population in the State of Ohio?
Total Welsh Population in Ohio is 110,680.
What is the Total Welsh Population in the United States?
Total Welsh Population in the United States is 1,736,338.