Cities with the Largest Welsh Community in South Carolina
RELATED REPORTS & OPTIONS
Welsh
South Carolina
Compare Cities
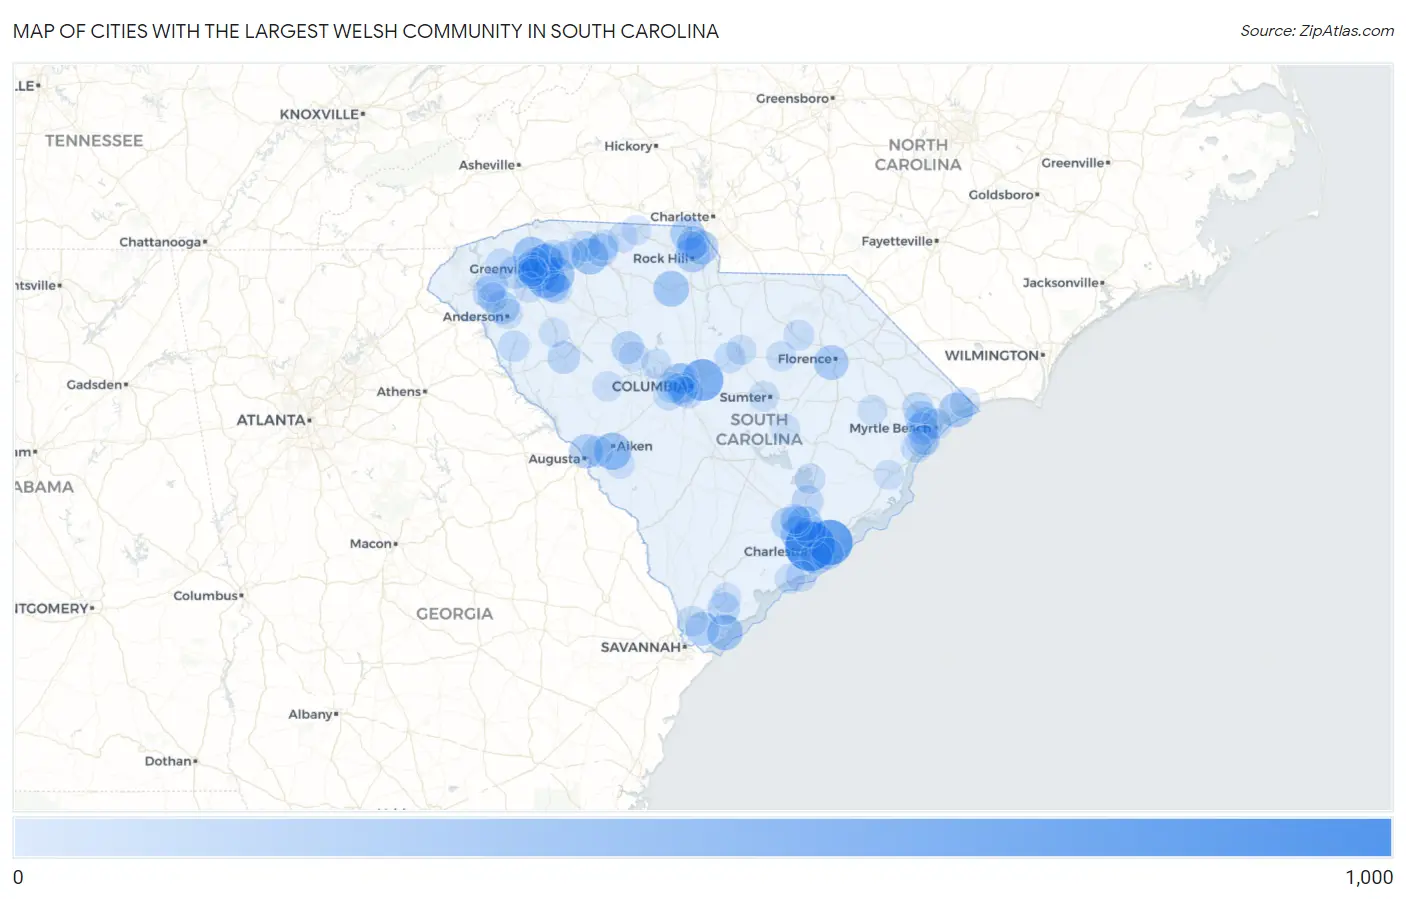
Map of Cities with the Largest Welsh Community in South Carolina
0
1,000
Cities with the Largest Welsh Community in South Carolina
| City | Welsh | vs State | vs National | |
| 1. | Charleston | 874 | 25,014(3.49%)#1 | 1,736,338(0.05%)#181 |
| 2. | Mount Pleasant | 683 | 25,014(2.73%)#2 | 1,736,338(0.04%)#250 |
| 3. | Columbia | 523 | 25,014(2.09%)#3 | 1,736,338(0.03%)#378 |
| 4. | Greenville | 413 | 25,014(1.65%)#4 | 1,736,338(0.02%)#525 |
| 5. | Mauldin | 387 | 25,014(1.55%)#5 | 1,736,338(0.02%)#587 |
| 6. | Wade Hampton | 373 | 25,014(1.49%)#6 | 1,736,338(0.02%)#622 |
| 7. | Aiken | 323 | 25,014(1.29%)#7 | 1,736,338(0.02%)#739 |
| 8. | Spartanburg | 292 | 25,014(1.17%)#8 | 1,736,338(0.02%)#841 |
| 9. | Travelers Rest | 291 | 25,014(1.16%)#9 | 1,736,338(0.02%)#844 |
| 10. | Five Forks | 285 | 25,014(1.14%)#10 | 1,736,338(0.02%)#864 |
| 11. | North Charleston | 264 | 25,014(1.06%)#11 | 1,736,338(0.02%)#935 |
| 12. | Chester | 262 | 25,014(1.05%)#12 | 1,736,338(0.02%)#950 |
| 13. | Hilton Head Island | 258 | 25,014(1.03%)#13 | 1,736,338(0.01%)#968 |
| 14. | Goose Creek | 227 | 25,014(0.91%)#14 | 1,736,338(0.01%)#1,124 |
| 15. | Florence | 225 | 25,014(0.90%)#15 | 1,736,338(0.01%)#1,137 |
| 16. | Rock Hill | 222 | 25,014(0.89%)#16 | 1,736,338(0.01%)#1,157 |
| 17. | North Myrtle Beach | 217 | 25,014(0.87%)#17 | 1,736,338(0.01%)#1,195 |
| 18. | Lake Wylie | 202 | 25,014(0.81%)#18 | 1,736,338(0.01%)#1,279 |
| 19. | Simpsonville | 198 | 25,014(0.79%)#19 | 1,736,338(0.01%)#1,305 |
| 20. | North Augusta | 196 | 25,014(0.78%)#20 | 1,736,338(0.01%)#1,320 |
| 21. | Fort Mill | 194 | 25,014(0.78%)#21 | 1,736,338(0.01%)#1,339 |
| 22. | Taylors | 185 | 25,014(0.74%)#22 | 1,736,338(0.01%)#1,394 |
| 23. | Bluffton | 175 | 25,014(0.70%)#23 | 1,736,338(0.01%)#1,493 |
| 24. | Seven Oaks | 161 | 25,014(0.64%)#24 | 1,736,338(0.01%)#1,642 |
| 25. | Northlake | 161 | 25,014(0.64%)#25 | 1,736,338(0.01%)#1,651 |
| 26. | Forestbrook | 152 | 25,014(0.61%)#26 | 1,736,338(0.01%)#1,759 |
| 27. | Clifton | 150 | 25,014(0.60%)#27 | 1,736,338(0.01%)#1,793 |
| 28. | Tega Cay | 144 | 25,014(0.58%)#28 | 1,736,338(0.01%)#1,878 |
| 29. | Red Hill | 143 | 25,014(0.57%)#29 | 1,736,338(0.01%)#1,899 |
| 30. | Summerville | 136 | 25,014(0.54%)#30 | 1,736,338(0.01%)#1,993 |
| 31. | Easley | 131 | 25,014(0.52%)#31 | 1,736,338(0.01%)#2,053 |
| 32. | Socastee | 129 | 25,014(0.52%)#32 | 1,736,338(0.01%)#2,080 |
| 33. | Newberry | 129 | 25,014(0.52%)#33 | 1,736,338(0.01%)#2,086 |
| 34. | Greenwood | 126 | 25,014(0.50%)#34 | 1,736,338(0.01%)#2,116 |
| 35. | Port Royal | 125 | 25,014(0.50%)#35 | 1,736,338(0.01%)#2,131 |
| 36. | James Island | 121 | 25,014(0.48%)#36 | 1,736,338(0.01%)#2,198 |
| 37. | Hanahan | 119 | 25,014(0.48%)#37 | 1,736,338(0.01%)#2,223 |
| 38. | Clemson | 118 | 25,014(0.47%)#38 | 1,736,338(0.01%)#2,243 |
| 39. | Sullivan S Island | 114 | 25,014(0.46%)#39 | 1,736,338(0.01%)#2,324 |
| 40. | Garden City | 106 | 25,014(0.42%)#40 | 1,736,338(0.01%)#2,469 |
| 41. | Cayce | 103 | 25,014(0.41%)#41 | 1,736,338(0.01%)#2,534 |
| 42. | Moncks Corner | 95 | 25,014(0.38%)#42 | 1,736,338(0.01%)#2,720 |
| 43. | Central | 94 | 25,014(0.38%)#43 | 1,736,338(0.01%)#2,752 |
| 44. | Parker | 92 | 25,014(0.37%)#44 | 1,736,338(0.01%)#2,791 |
| 45. | Carolina Forest | 87 | 25,014(0.35%)#45 | 1,736,338(0.01%)#2,921 |
| 46. | West Columbia | 80 | 25,014(0.32%)#46 | 1,736,338(0.00%)#3,134 |
| 47. | St Andrews | 77 | 25,014(0.31%)#47 | 1,736,338(0.00%)#3,239 |
| 48. | Lake Secession | 76 | 25,014(0.30%)#48 | 1,736,338(0.00%)#3,305 |
| 49. | Ladson | 75 | 25,014(0.30%)#49 | 1,736,338(0.00%)#3,315 |
| 50. | Oak Grove | 74 | 25,014(0.30%)#50 | 1,736,338(0.00%)#3,353 |
| 51. | Burnettown | 73 | 25,014(0.29%)#51 | 1,736,338(0.00%)#3,404 |
| 52. | Red Bank | 71 | 25,014(0.28%)#52 | 1,736,338(0.00%)#3,454 |
| 53. | La France | 70 | 25,014(0.28%)#53 | 1,736,338(0.00%)#3,517 |
| 54. | Lexington | 69 | 25,014(0.28%)#54 | 1,736,338(0.00%)#3,528 |
| 55. | Conway | 68 | 25,014(0.27%)#55 | 1,736,338(0.00%)#3,571 |
| 56. | Lugoff | 65 | 25,014(0.26%)#56 | 1,736,338(0.00%)#3,678 |
| 57. | Valley Falls | 63 | 25,014(0.25%)#57 | 1,736,338(0.00%)#3,758 |
| 58. | Pickens | 62 | 25,014(0.25%)#58 | 1,736,338(0.00%)#3,809 |
| 59. | Hardeeville | 56 | 25,014(0.22%)#59 | 1,736,338(0.00%)#4,073 |
| 60. | Welcome | 56 | 25,014(0.22%)#60 | 1,736,338(0.00%)#4,077 |
| 61. | Kiawah Island | 56 | 25,014(0.22%)#61 | 1,736,338(0.00%)#4,096 |
| 62. | Cowpens | 56 | 25,014(0.22%)#62 | 1,736,338(0.00%)#4,099 |
| 63. | Hartsville | 52 | 25,014(0.21%)#63 | 1,736,338(0.00%)#4,272 |
| 64. | Wellford | 52 | 25,014(0.21%)#64 | 1,736,338(0.00%)#4,289 |
| 65. | Greer | 51 | 25,014(0.20%)#65 | 1,736,338(0.00%)#4,314 |
| 66. | Sumter | 49 | 25,014(0.20%)#66 | 1,736,338(0.00%)#4,438 |
| 67. | Myrtle Beach | 49 | 25,014(0.20%)#67 | 1,736,338(0.00%)#4,440 |
| 68. | Murrells Inlet | 45 | 25,014(0.18%)#68 | 1,736,338(0.00%)#4,718 |
| 69. | Bonneau Beach | 45 | 25,014(0.18%)#69 | 1,736,338(0.00%)#4,766 |
| 70. | Anderson | 44 | 25,014(0.18%)#70 | 1,736,338(0.00%)#4,776 |
| 71. | Little River | 44 | 25,014(0.18%)#71 | 1,736,338(0.00%)#4,792 |
| 72. | Piedmont | 43 | 25,014(0.17%)#72 | 1,736,338(0.00%)#4,864 |
| 73. | India Hook | 42 | 25,014(0.17%)#73 | 1,736,338(0.00%)#4,947 |
| 74. | Litchfield Beach | 40 | 25,014(0.16%)#74 | 1,736,338(0.00%)#5,067 |
| 75. | Pendleton | 40 | 25,014(0.16%)#75 | 1,736,338(0.00%)#5,098 |
| 76. | Dunean | 40 | 25,014(0.16%)#76 | 1,736,338(0.00%)#5,099 |
| 77. | Sans Souci | 35 | 25,014(0.14%)#77 | 1,736,338(0.00%)#5,491 |
| 78. | Sangaree | 34 | 25,014(0.14%)#78 | 1,736,338(0.00%)#5,579 |
| 79. | New Ellenton | 34 | 25,014(0.14%)#79 | 1,736,338(0.00%)#5,615 |
| 80. | Saluda | 33 | 25,014(0.13%)#80 | 1,736,338(0.00%)#5,692 |
| 81. | Fountain Inn | 32 | 25,014(0.13%)#81 | 1,736,338(0.00%)#5,742 |
| 82. | Camden | 32 | 25,014(0.13%)#82 | 1,736,338(0.00%)#5,755 |
| 83. | Bishopville | 32 | 25,014(0.13%)#83 | 1,736,338(0.00%)#5,796 |
| 84. | Seabrook Island | 32 | 25,014(0.13%)#84 | 1,736,338(0.00%)#5,815 |
| 85. | Judson | 32 | 25,014(0.13%)#85 | 1,736,338(0.00%)#5,819 |
| 86. | Prosperity | 32 | 25,014(0.13%)#86 | 1,736,338(0.00%)#5,833 |
| 87. | Gaffney | 29 | 25,014(0.12%)#87 | 1,736,338(0.00%)#6,081 |
| 88. | Surfside Beach | 29 | 25,014(0.12%)#88 | 1,736,338(0.00%)#6,124 |
| 89. | Keowee Key | 29 | 25,014(0.12%)#89 | 1,736,338(0.00%)#6,138 |
| 90. | Chapin | 29 | 25,014(0.12%)#90 | 1,736,338(0.00%)#6,163 |
| 91. | Beaufort | 28 | 25,014(0.11%)#91 | 1,736,338(0.00%)#6,208 |
| 92. | Johnsonville | 28 | 25,014(0.11%)#92 | 1,736,338(0.00%)#6,319 |
| 93. | Ware Shoals | 27 | 25,014(0.11%)#93 | 1,736,338(0.00%)#6,412 |
| 94. | Georgetown | 26 | 25,014(0.10%)#94 | 1,736,338(0.00%)#6,472 |
| 95. | Duncan | 26 | 25,014(0.10%)#95 | 1,736,338(0.00%)#6,501 |
| 96. | Beech Island | 26 | 25,014(0.10%)#96 | 1,736,338(0.00%)#6,543 |
| 97. | Fripp Island | 25 | 25,014(0.10%)#97 | 1,736,338(0.00%)#6,688 |
| 98. | Springdale | 24 | 25,014(0.10%)#98 | 1,736,338(0.00%)#6,783 |
| 99. | Blacksburg | 23 | 25,014(0.09%)#99 | 1,736,338(0.00%)#6,956 |
| 100. | Manning | 21 | 25,014(0.08%)#100 | 1,736,338(0.00%)#7,244 |
Common Questions
What are the Top 10 Cities with the Largest Welsh Community in South Carolina?
Top 10 Cities with the Largest Welsh Community in South Carolina are:
#1
874
#2
683
#3
523
#4
413
#5
387
#6
373
#7
323
#8
292
#9
291
#10
285
What city has the Largest Welsh Community in South Carolina?
Charleston has the Largest Welsh Community in South Carolina with 874.
What is the Total Welsh Population in the State of South Carolina?
Total Welsh Population in South Carolina is 25,014.
What is the Total Welsh Population in the United States?
Total Welsh Population in the United States is 1,736,338.