Cities with the Highest Median Property Prices in Virginia
RELATED REPORTS & OPTIONS
Highest Property Prices
Virginia
Compare Cities
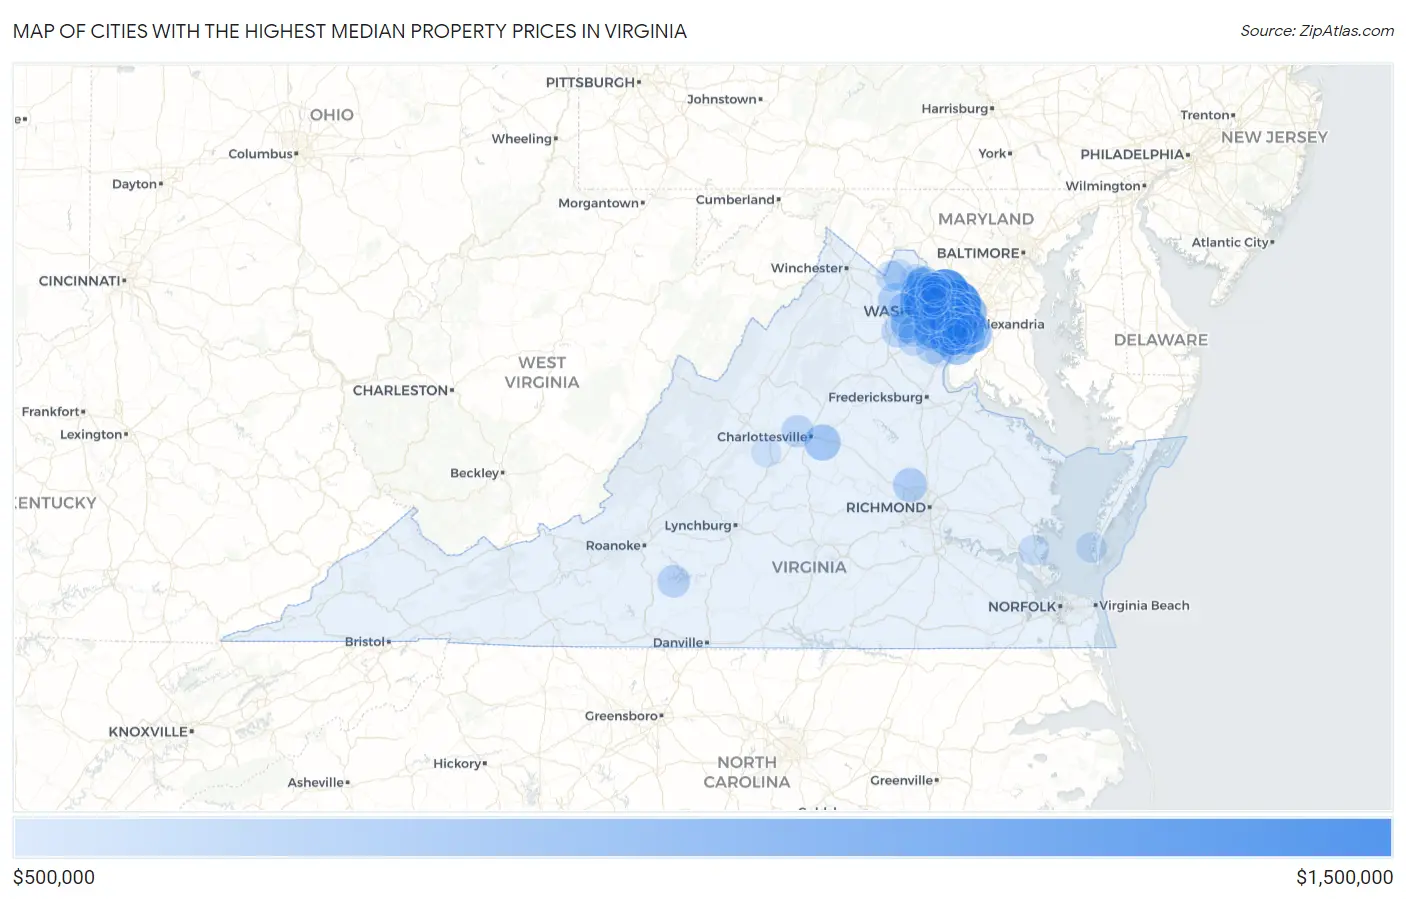
Map of Cities with the Highest Median Property Prices in Virginia
$0
$1,500,000
Cities with the Highest Median Property Prices in Virginia
| City | Avg Property Price | vs State | vs National | |
| 1. | Mclean | $1,265,235 | $337,639(+928k)#1 | $281,181(+984k)#287 |
| 2. | Great Falls | $1,249,033 | $337,639(+911k)#2 | $281,181(+968k)#295 |
| 3. | Wolf Trap | $1,099,960 | $337,639(+762k)#3 | $281,181(+819k)#394 |
| 4. | Difficult Run | $1,021,990 | $337,639(+684k)#4 | $281,181(+741k)#465 |
| 5. | Clifton | $953,881 | $337,639(+616k)#5 | $281,181(+673k)#549 |
| 6. | Great Falls Crossing | $952,248 | $337,639(+615k)#6 | $281,181(+671k)#553 |
| 7. | Falls Church | $943,265 | $337,639(+606k)#7 | $281,181(+662k)#569 |
| 8. | Dunn Loring | $913,709 | $337,639(+576k)#8 | $281,181(+633k)#610 |
| 9. | Vienna | $910,510 | $337,639(+573k)#9 | $281,181(+629k)#616 |
| 10. | Union Mill | $907,471 | $337,639(+570k)#10 | $281,181(+626k)#622 |
| 11. | Navy | $905,395 | $337,639(+568k)#11 | $281,181(+624k)#626 |
| 12. | Crosspointe | $898,709 | $337,639(+561k)#12 | $281,181(+618k)#641 |
| 13. | South Run | $896,417 | $337,639(+559k)#13 | $281,181(+615k)#645 |
| 14. | Mantua | $891,506 | $337,639(+554k)#14 | $281,181(+610k)#651 |
| 15. | Braddock | $887,932 | $337,639(+550k)#15 | $281,181(+607k)#657 |
| 16. | Pimmit Hills | $871,562 | $337,639(+534k)#16 | $281,181(+590k)#685 |
| 17. | Fort Hunt | $839,448 | $337,639(+502k)#17 | $281,181(+558k)#762 |
| 18. | Arlington | $834,241 | $337,639(+497k)#18 | $281,181(+553k)#780 |
| 19. | Lake Barcroft | $825,816 | $337,639(+488k)#19 | $281,181(+545k)#796 |
| 20. | Broadlands | $815,946 | $337,639(+478k)#20 | $281,181(+535k)#814 |
| 21. | Fairfax Station | $815,875 | $337,639(+478k)#21 | $281,181(+535k)#815 |
| 22. | Floris | $811,847 | $337,639(+474k)#22 | $281,181(+531k)#824 |
| 23. | Brambleton | $800,674 | $337,639(+463k)#23 | $281,181(+519k)#854 |
| 24. | Mason Neck | $779,371 | $337,639(+442k)#24 | $281,181(+498k)#910 |
| 25. | Moorefield | $770,464 | $337,639(+433k)#25 | $281,181(+489k)#938 |
| 26. | Woodburn | $770,366 | $337,639(+433k)#26 | $281,181(+489k)#939 |
| 27. | Franklin Farm | $767,667 | $337,639(+430k)#27 | $281,181(+486k)#950 |
| 28. | Oakton | $763,628 | $337,639(+426k)#28 | $281,181(+482k)#958 |
| 29. | Belmont | $750,190 | $337,639(+413k)#29 | $281,181(+469k)#990 |
| 30. | Rivanna | $745,800 | $337,639(+408k)#30 | $281,181(+465k)#1,000 |
| 31. | Mount Vernon | $726,521 | $337,639(+389k)#31 | $281,181(+445k)#1,058 |
| 32. | Loudoun Valley Estates | $719,451 | $337,639(+382k)#32 | $281,181(+438k)#1,083 |
| 33. | Lowes Island | $704,528 | $337,639(+367k)#33 | $281,181(+423k)#1,143 |
| 34. | Idylwood | $700,014 | $337,639(+362k)#34 | $281,181(+419k)#1,162 |
| 35. | Lansdowne | $696,243 | $337,639(+359k)#35 | $281,181(+415k)#1,174 |
| 36. | Long Branch | $692,518 | $337,639(+355k)#36 | $281,181(+411k)#1,194 |
| 37. | Dranesville | $690,179 | $337,639(+353k)#37 | $281,181(+409k)#1,205 |
| 38. | Wyndham | $667,921 | $337,639(+330k)#38 | $281,181(+387k)#1,298 |
| 39. | George Mason | $665,859 | $337,639(+328k)#39 | $281,181(+385k)#1,309 |
| 40. | Middleburg | $663,559 | $337,639(+326k)#40 | $281,181(+382k)#1,318 |
| 41. | Alexandria | $655,727 | $337,639(+318k)#41 | $281,181(+375k)#1,367 |
| 42. | Stone Ridge | $652,177 | $337,639(+315k)#42 | $281,181(+371k)#1,384 |
| 43. | South Riding | $651,499 | $337,639(+314k)#43 | $281,181(+370k)#1,391 |
| 44. | Fairfax | $649,337 | $337,639(+312k)#44 | $281,181(+368k)#1,398 |
| 45. | Burke | $648,290 | $337,639(+311k)#45 | $281,181(+367k)#1,404 |
| 46. | Rose Hill Cdp Fairfax County | $642,817 | $337,639(+305k)#46 | $281,181(+362k)#1,437 |
| 47. | Kings Park West | $638,970 | $337,639(+301k)#47 | $281,181(+358k)#1,457 |
| 48. | Hayfield | $636,839 | $337,639(+299k)#48 | $281,181(+356k)#1,467 |
| 49. | West Falls Church | $635,897 | $337,639(+298k)#49 | $281,181(+355k)#1,472 |
| 50. | Gainesville | $634,016 | $337,639(+296k)#50 | $281,181(+353k)#1,484 |
| 51. | Greenbriar | $625,792 | $337,639(+288k)#51 | $281,181(+345k)#1,526 |
| 52. | Ravensworth | $622,664 | $337,639(+285k)#52 | $281,181(+341k)#1,543 |
| 53. | Tysons | $621,826 | $337,639(+284k)#53 | $281,181(+341k)#1,550 |
| 54. | Ashburn | $618,435 | $337,639(+281k)#54 | $281,181(+337k)#1,568 |
| 55. | Independent Hill | $618,363 | $337,639(+281k)#55 | $281,181(+337k)#1,570 |
| 56. | Annandale | $615,175 | $337,639(+278k)#56 | $281,181(+334k)#1,591 |
| 57. | Chantilly | $613,490 | $337,639(+276k)#57 | $281,181(+332k)#1,606 |
| 58. | Union Hall | $611,486 | $337,639(+274k)#58 | $281,181(+330k)#1,623 |
| 59. | Laurel Hill | $609,595 | $337,639(+272k)#59 | $281,181(+328k)#1,633 |
| 60. | Kings Park | $602,601 | $337,639(+265k)#60 | $281,181(+321k)#1,685 |
| 61. | Ivy | $601,829 | $337,639(+264k)#61 | $281,181(+321k)#1,690 |
| 62. | Belle Haven | $600,580 | $337,639(+263k)#62 | $281,181(+319k)#1,699 |
| 63. | North Springfield | $600,107 | $337,639(+262k)#63 | $281,181(+319k)#1,704 |
| 64. | Merrifield | $599,438 | $337,639(+262k)#64 | $281,181(+318k)#1,710 |
| 65. | New Baltimore | $598,663 | $337,639(+261k)#65 | $281,181(+317k)#1,715 |
| 66. | Springfield | $593,906 | $337,639(+256k)#66 | $281,181(+313k)#1,752 |
| 67. | West Springfield | $592,901 | $337,639(+255k)#67 | $281,181(+312k)#1,758 |
| 68. | Reston | $591,492 | $337,639(+254k)#68 | $281,181(+310k)#1,768 |
| 69. | Kingstowne | $584,584 | $337,639(+247k)#69 | $281,181(+303k)#1,816 |
| 70. | Lincolnia | $582,670 | $337,639(+245k)#70 | $281,181(+301k)#1,833 |
| 71. | Cascades | $580,562 | $337,639(+243k)#71 | $281,181(+299k)#1,846 |
| 72. | Bull Run Mountain Estates | $574,396 | $337,639(+237k)#72 | $281,181(+293k)#1,894 |
| 73. | Nokesville | $573,082 | $337,639(+235k)#73 | $281,181(+292k)#1,899 |
| 74. | Leesburg | $571,492 | $337,639(+234k)#74 | $281,181(+290k)#1,910 |
| 75. | Purcellville | $570,493 | $337,639(+233k)#75 | $281,181(+289k)#1,924 |
| 76. | Burke Centre | $566,927 | $337,639(+229k)#76 | $281,181(+286k)#1,960 |
| 77. | Haymarket | $566,211 | $337,639(+229k)#77 | $281,181(+285k)#1,963 |
| 78. | Arcola | $565,631 | $337,639(+228k)#78 | $281,181(+284k)#1,969 |
| 79. | Buckhall | $560,697 | $337,639(+223k)#79 | $281,181(+280k)#1,995 |
| 80. | Linton Hall | $559,479 | $337,639(+222k)#80 | $281,181(+278k)#2,008 |
| 81. | Lorton | $553,487 | $337,639(+216k)#81 | $281,181(+272k)#2,052 |
| 82. | Fair Oaks | $551,910 | $337,639(+214k)#82 | $281,181(+271k)#2,063 |
| 83. | Dulles Town Center | $550,403 | $337,639(+213k)#83 | $281,181(+269k)#2,070 |
| 84. | Round Hill | $550,097 | $337,639(+212k)#84 | $281,181(+269k)#2,071 |
| 85. | Oak Grove | $548,585 | $337,639(+211k)#85 | $281,181(+267k)#2,084 |
| 86. | Fair Lakes | $544,003 | $337,639(+206k)#86 | $281,181(+263k)#2,110 |
| 87. | Cape Charles | $540,108 | $337,639(+202k)#87 | $281,181(+259k)#2,134 |
| 88. | Goose Creek | $537,223 | $337,639(+200k)#88 | $281,181(+256k)#2,154 |
| 89. | Newington Forest | $536,704 | $337,639(+199k)#89 | $281,181(+256k)#2,157 |
| 90. | Yorktown | $535,000 | $337,639(+197k)#90 | $281,181(+254k)#2,169 |
| 91. | Centreville | $530,106 | $337,639(+192k)#91 | $281,181(+249k)#2,200 |
| 92. | Mcnair | $529,825 | $337,639(+192k)#92 | $281,181(+249k)#2,203 |
| 93. | Groveton | $528,663 | $337,639(+191k)#93 | $281,181(+247k)#2,214 |
| 94. | North Garden | $525,679 | $337,639(+188k)#94 | $281,181(+244k)#2,231 |
| 95. | Countryside | $524,747 | $337,639(+187k)#95 | $281,181(+244k)#2,236 |
| 96. | Herndon | $523,327 | $337,639(+186k)#96 | $281,181(+242k)#2,249 |
| 97. | Sugarland Run | $522,750 | $337,639(+185k)#97 | $281,181(+242k)#2,254 |
| 98. | Nellysford | $516,456 | $337,639(+179k)#98 | $281,181(+235k)#2,291 |
| 99. | Montclair | $515,547 | $337,639(+178k)#99 | $281,181(+234k)#2,298 |
| 100. | Newington | $515,223 | $337,639(+178k)#100 | $281,181(+234k)#2,302 |
Common Questions
What are the Top 10 Cities with the Highest Median Property Prices in Virginia?
Top 10 Cities with the Highest Median Property Prices in Virginia are:
#1
$1,265,235
#2
$1,249,033
#3
$1,099,960
#4
$953,881
#5
$943,265
#6
$913,709
#7
$910,510
#8
$898,709
#9
$896,417
#10
$891,506
What city has the Highest Median Property Prices in Virginia?
McLean has the Highest Median Property Prices in Virginia with $1,265,235.
What is the Median Property Prices in the State of Virginia?
Median Property Prices in Virginia is $337,639.
What is the Median Property Prices in the United States?
Median Property Prices in the United States is $281,181.