Cities with the Highest Median Property Prices in Pennsylvania
RELATED REPORTS & OPTIONS
Highest Property Prices
Pennsylvania
Compare Cities
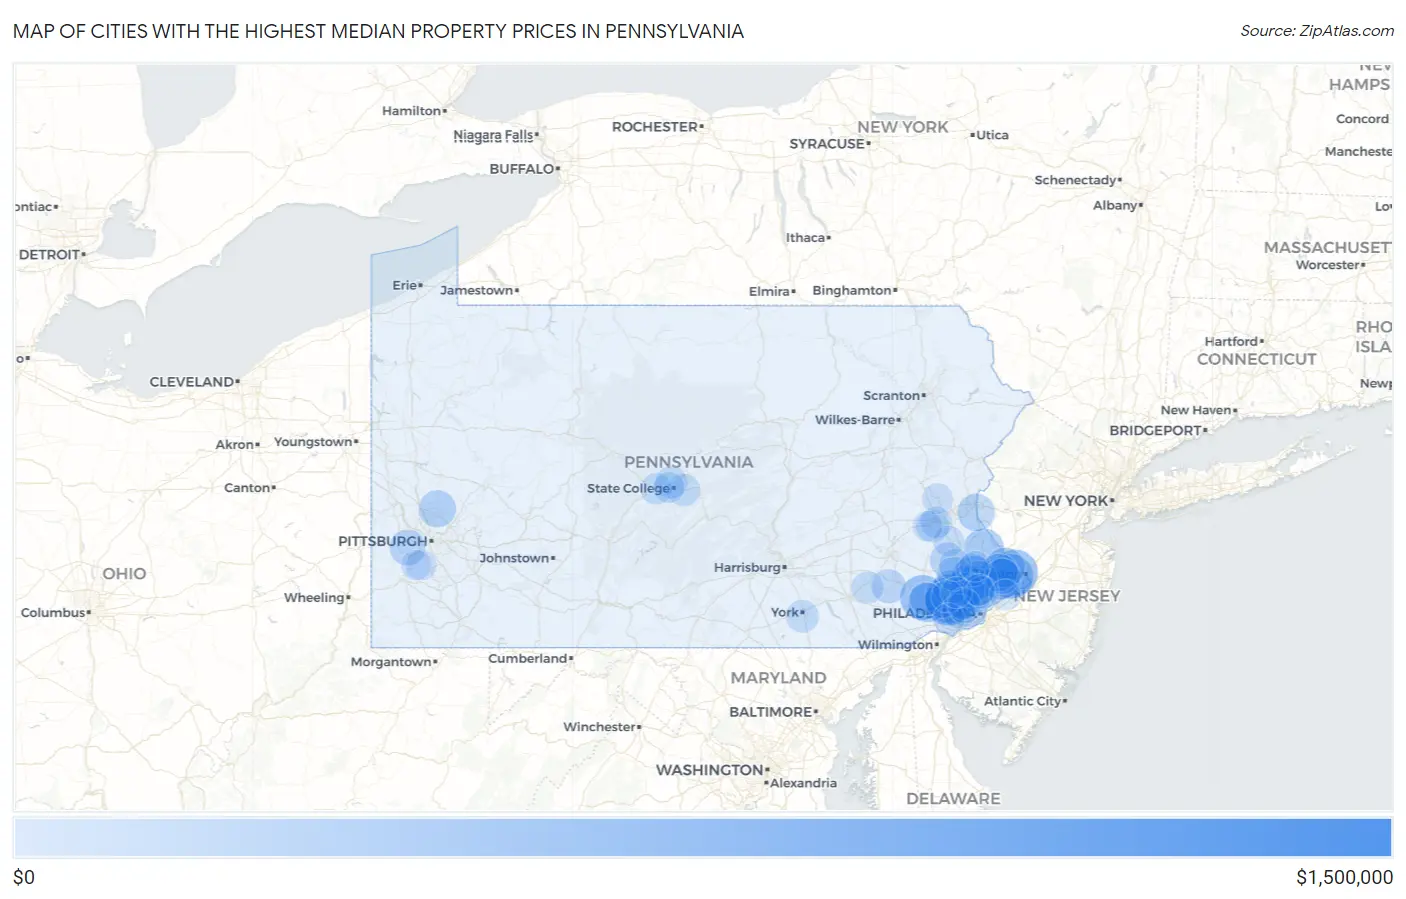
Map of Cities with the Highest Median Property Prices in Pennsylvania
$0
$1,500,000
Cities with the Highest Median Property Prices in Pennsylvania
| City | Avg Property Price | vs State | vs National | |
| 1. | Sewickley Heights Borough | $1,017,159 | $225,125(+792k)#1 | $281,181(+736k)#470 |
| 2. | St. Davids | $952,813 | $225,125(+728k)#2 | $281,181(+672k)#552 |
| 3. | Villanova | $858,014 | $225,125(+633k)#3 | $281,181(+577k)#718 |
| 4. | Fox Chapel Borough | $855,467 | $225,125(+630k)#4 | $281,181(+574k)#723 |
| 5. | Merion Station | $831,076 | $225,125(+606k)#5 | $281,181(+550k)#785 |
| 6. | Edgeworth Borough | $729,787 | $225,125(+505k)#6 | $281,181(+449k)#1,045 |
| 7. | Newtown Borough | $691,783 | $225,125(+467k)#7 | $281,181(+411k)#1,198 |
| 8. | Rose Valley Borough | $679,916 | $225,125(+455k)#8 | $281,181(+399k)#1,244 |
| 9. | Devon | $670,769 | $225,125(+446k)#9 | $281,181(+390k)#1,283 |
| 10. | Wayne | $666,242 | $225,125(+441k)#10 | $281,181(+385k)#1,307 |
| 11. | Bryn Athyn Borough | $659,888 | $225,125(+435k)#11 | $281,181(+379k)#1,342 |
| 12. | Berwyn | $654,990 | $225,125(+430k)#12 | $281,181(+374k)#1,373 |
| 13. | Eagles Mere Borough | $637,289 | $225,125(+412k)#13 | $281,181(+356k)#1,466 |
| 14. | Woodside | $613,417 | $225,125(+388k)#14 | $281,181(+332k)#1,607 |
| 15. | Narberth Borough | $613,271 | $225,125(+388k)#15 | $281,181(+332k)#1,608 |
| 16. | Spring House | $602,145 | $225,125(+377k)#16 | $281,181(+321k)#1,686 |
| 17. | Rosemont | $601,016 | $225,125(+376k)#17 | $281,181(+320k)#1,695 |
| 18. | Eagleview | $596,034 | $225,125(+371k)#18 | $281,181(+315k)#1,732 |
| 19. | Bala Cynwyd | $595,699 | $225,125(+371k)#19 | $281,181(+315k)#1,735 |
| 20. | New Hope Borough | $595,486 | $225,125(+370k)#20 | $281,181(+314k)#1,740 |
| 21. | Woodbourne | $590,307 | $225,125(+365k)#21 | $281,181(+309k)#1,778 |
| 22. | Churchville | $544,736 | $225,125(+320k)#22 | $281,181(+264k)#2,107 |
| 23. | Fort Washington | $527,871 | $225,125(+303k)#23 | $281,181(+247k)#2,220 |
| 24. | Plumsteadville | $525,997 | $225,125(+301k)#24 | $281,181(+245k)#2,229 |
| 25. | Blue Bell | $525,951 | $225,125(+301k)#25 | $281,181(+245k)#2,230 |
| 26. | Newtown Grant | $516,339 | $225,125(+291k)#26 | $281,181(+235k)#2,292 |
| 27. | Frazer | $513,412 | $225,125(+288k)#27 | $281,181(+232k)#2,314 |
| 28. | Exton | $507,898 | $225,125(+283k)#28 | $281,181(+227k)#2,350 |
| 29. | Sewickley Hills Borough | $500,521 | $225,125(+275k)#29 | $281,181(+219k)#2,392 |
| 30. | Glen Osborne Borough | $494,725 | $225,125(+270k)#30 | $281,181(+214k)#2,439 |
| 31. | Maple Glen | $493,643 | $225,125(+269k)#31 | $281,181(+212k)#2,446 |
| 32. | Swarthmore Borough | $490,907 | $225,125(+266k)#32 | $281,181(+210k)#2,466 |
| 33. | Doylestown Borough | $489,282 | $225,125(+264k)#33 | $281,181(+208k)#2,489 |
| 34. | Ben Avon Heights Borough | $487,306 | $225,125(+262k)#34 | $281,181(+206k)#2,505 |
| 35. | Sewickley Borough | $480,951 | $225,125(+256k)#35 | $281,181(+200k)#2,563 |
| 36. | Richboro | $480,919 | $225,125(+256k)#36 | $281,181(+200k)#2,564 |
| 37. | Raubsville | $478,629 | $225,125(+254k)#37 | $281,181(+197k)#2,583 |
| 38. | Malvern Borough | $476,735 | $225,125(+252k)#38 | $281,181(+196k)#2,610 |
| 39. | Dilworthtown | $475,949 | $225,125(+251k)#39 | $281,181(+195k)#2,616 |
| 40. | Langhorne Manor Borough | $474,831 | $225,125(+250k)#40 | $281,181(+194k)#2,627 |
| 41. | Bakerstown | $472,615 | $225,125(+247k)#41 | $281,181(+191k)#2,654 |
| 42. | Penn Wynne | $465,315 | $225,125(+240k)#42 | $281,181(+184k)#2,730 |
| 43. | Wyndmoor | $463,720 | $225,125(+239k)#43 | $281,181(+183k)#2,744 |
| 44. | West Chester Borough | $462,940 | $225,125(+238k)#44 | $281,181(+182k)#2,754 |
| 45. | Chadds Ford | $454,427 | $225,125(+229k)#45 | $281,181(+173k)#2,857 |
| 46. | Noblestown | $451,786 | $225,125(+227k)#46 | $281,181(+171k)#2,885 |
| 47. | Yardley Borough | $450,163 | $225,125(+225k)#47 | $281,181(+169k)#2,913 |
| 48. | Flourtown | $446,568 | $225,125(+221k)#48 | $281,181(+165k)#2,964 |
| 49. | Paoli | $444,675 | $225,125(+220k)#49 | $281,181(+163k)#2,999 |
| 50. | Ivyland Borough | $444,668 | $225,125(+220k)#50 | $281,181(+163k)#3,000 |
| 51. | Village Shires | $443,909 | $225,125(+219k)#51 | $281,181(+163k)#3,007 |
| 52. | Woxall | $440,929 | $225,125(+216k)#52 | $281,181(+160k)#3,047 |
| 53. | Bradford Woods Borough | $439,923 | $225,125(+215k)#53 | $281,181(+159k)#3,061 |
| 54. | Franklin Park Borough | $436,243 | $225,125(+211k)#54 | $281,181(+155k)#3,112 |
| 55. | Plymouth Meeting | $432,611 | $225,125(+207k)#55 | $281,181(+151k)#3,149 |
| 56. | Audubon | $430,619 | $225,125(+205k)#56 | $281,181(+149k)#3,169 |
| 57. | Churchtown | $425,110 | $225,125(+200k)#57 | $281,181(+144k)#3,248 |
| 58. | Broomall | $421,779 | $225,125(+197k)#58 | $281,181(+141k)#3,291 |
| 59. | Ardmore | $420,689 | $225,125(+196k)#59 | $281,181(+140k)#3,302 |
| 60. | Skippack | $418,657 | $225,125(+194k)#60 | $281,181(+137k)#3,332 |
| 61. | Chalfont Borough | $412,422 | $225,125(+187k)#61 | $281,181(+131k)#3,424 |
| 62. | Lionville | $409,449 | $225,125(+184k)#62 | $281,181(+128k)#3,474 |
| 63. | Langhorne Borough | $408,915 | $225,125(+184k)#63 | $281,181(+128k)#3,486 |
| 64. | Seven Fields Borough | $407,443 | $225,125(+182k)#64 | $281,181(+126k)#3,510 |
| 65. | Grantley | $404,889 | $225,125(+180k)#65 | $281,181(+124k)#3,549 |
| 66. | Kimberton | $404,614 | $225,125(+179k)#66 | $281,181(+123k)#3,558 |
| 67. | Montgomeryville | $403,643 | $225,125(+179k)#67 | $281,181(+122k)#3,579 |
| 68. | Boalsburg | $401,926 | $225,125(+177k)#68 | $281,181(+121k)#3,601 |
| 69. | Media Borough | $398,647 | $225,125(+174k)#69 | $281,181(+117k)#3,637 |
| 70. | Chesterbrook | $397,444 | $225,125(+172k)#70 | $281,181(+116k)#3,656 |
| 71. | Wyncote | $397,337 | $225,125(+172k)#71 | $281,181(+116k)#3,659 |
| 72. | Glenmoore | $396,987 | $225,125(+172k)#72 | $281,181(+116k)#3,670 |
| 73. | Thornburg Borough | $396,952 | $225,125(+172k)#73 | $281,181(+116k)#3,671 |
| 74. | Ancient Oaks | $396,551 | $225,125(+171k)#74 | $281,181(+115k)#3,678 |
| 75. | Toftrees | $396,200 | $225,125(+171k)#75 | $281,181(+115k)#3,684 |
| 76. | Farmersville | $394,423 | $225,125(+169k)#76 | $281,181(+113k)#3,713 |
| 77. | Harleysville | $393,543 | $225,125(+168k)#77 | $281,181(+112k)#3,728 |
| 78. | West Conshohocken Borough | $393,330 | $225,125(+168k)#78 | $281,181(+112k)#3,731 |
| 79. | Pughtown | $392,949 | $225,125(+168k)#79 | $281,181(+112k)#3,746 |
| 80. | Bryn Mawr | $390,796 | $225,125(+166k)#80 | $281,181(+110k)#3,773 |
| 81. | State College Borough | $389,332 | $225,125(+164k)#81 | $281,181(+108k)#3,795 |
| 82. | Wescosville | $387,758 | $225,125(+163k)#82 | $281,181(+107k)#3,824 |
| 83. | Oreland | $386,120 | $225,125(+161k)#83 | $281,181(+105k)#3,851 |
| 84. | Stormstown | $385,212 | $225,125(+160k)#84 | $281,181(+104k)#3,863 |
| 85. | Conshohocken Borough | $383,561 | $225,125(+158k)#85 | $281,181(+102k)#3,898 |
| 86. | Collegeville Borough | $383,357 | $225,125(+158k)#86 | $281,181(+102k)#3,902 |
| 87. | Lima | $381,373 | $225,125(+156k)#87 | $281,181(+100k)#3,936 |
| 88. | Bell Acres Borough | $378,261 | $225,125(+153k)#88 | $281,181(+97.1k)#3,990 |
| 89. | Park Forest Village | $377,283 | $225,125(+152k)#89 | $281,181(+96.1k)#4,013 |
| 90. | Rosslyn Farms Borough | $375,250 | $225,125(+150k)#90 | $281,181(+94.1k)#4,050 |
| 91. | Cornwells Heights | $374,847 | $225,125(+150k)#91 | $281,181(+93.7k)#4,058 |
| 92. | King Of Prussia | $374,240 | $225,125(+149k)#92 | $281,181(+93.1k)#4,070 |
| 93. | Spinnerstown | $373,733 | $225,125(+149k)#93 | $281,181(+92.6k)#4,082 |
| 94. | Laurys Station | $373,593 | $225,125(+148k)#94 | $281,181(+92.4k)#4,084 |
| 95. | Brittany Farms The Highlands | $371,349 | $225,125(+146k)#95 | $281,181(+90.2k)#4,124 |
| 96. | Mcmurray | $369,855 | $225,125(+145k)#96 | $281,181(+88.7k)#4,155 |
| 97. | Aspinwall Borough | $366,559 | $225,125(+141k)#97 | $281,181(+85.4k)#4,208 |
| 98. | Breinigsville | $364,794 | $225,125(+140k)#98 | $281,181(+83.6k)#4,245 |
| 99. | Thompsonville | $361,575 | $225,125(+136k)#99 | $281,181(+80.4k)#4,300 |
| 100. | New Britain Borough | $355,432 | $225,125(+130k)#100 | $281,181(+74.3k)#4,411 |
Common Questions
What are the Top 10 Cities with the Highest Median Property Prices in Pennsylvania?
Top 10 Cities with the Highest Median Property Prices in Pennsylvania are:
#1
$670,769
#2
$654,990
#3
$613,417
#4
$602,145
#5
$596,034
#6
$590,307
#7
$544,736
#8
$527,871
#9
$525,997
#10
$525,951
What city has the Highest Median Property Prices in Pennsylvania?
Devon has the Highest Median Property Prices in Pennsylvania with $670,769.
What is the Median Property Prices in the State of Pennsylvania?
Median Property Prices in Pennsylvania is $225,125.
What is the Median Property Prices in the United States?
Median Property Prices in the United States is $281,181.