Cities with the Most Immigrants from Romania in Pennsylvania
RELATED REPORTS & OPTIONS
Romania
Pennsylvania
Compare Cities
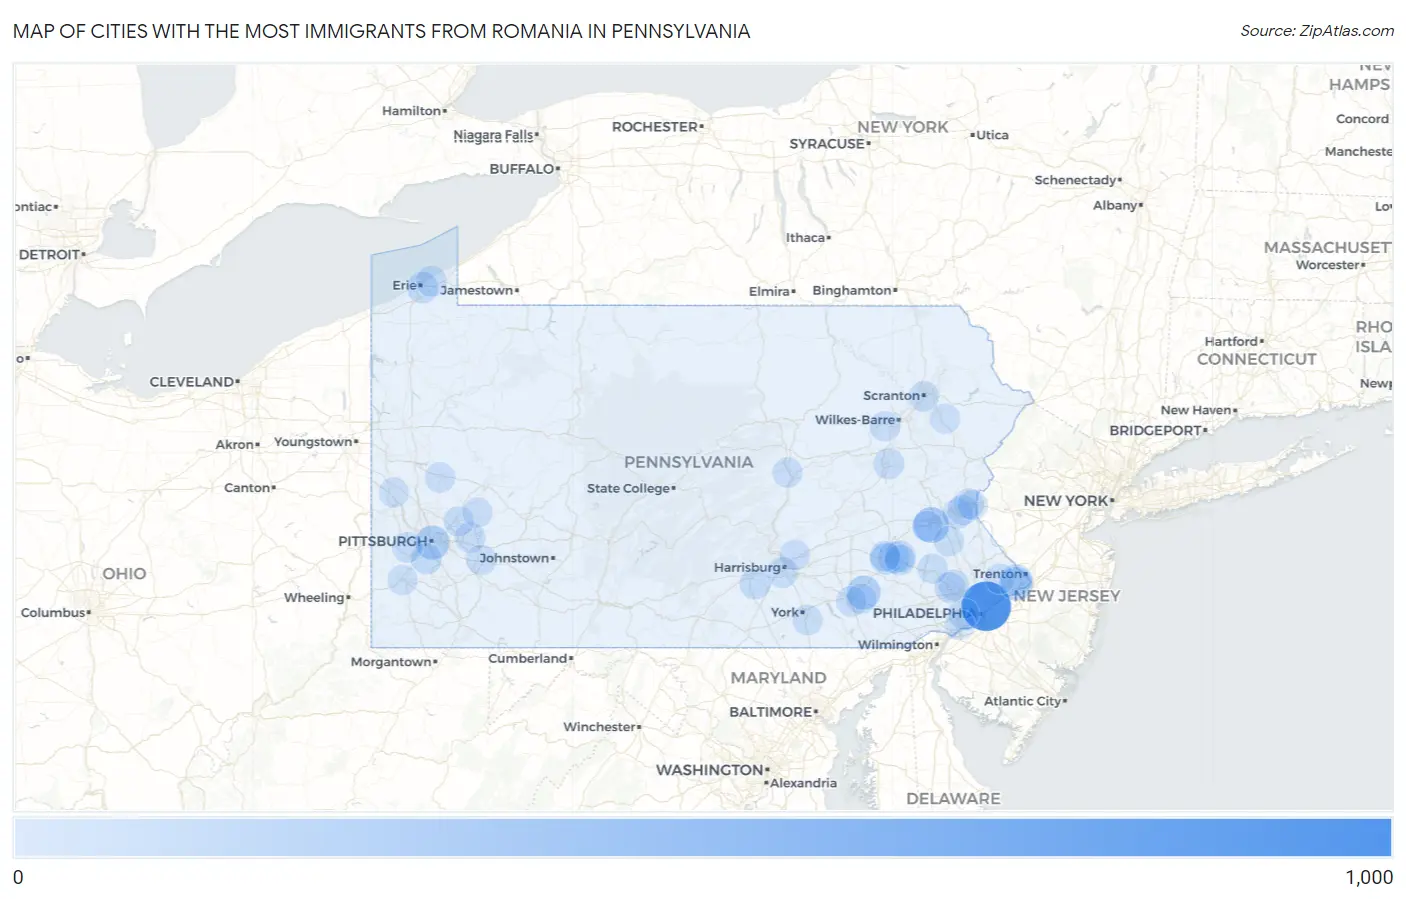
Map of Cities with the Most Immigrants from Romania in Pennsylvania
0
1,000
Cities with the Most Immigrants from Romania in Pennsylvania
| City | Romania | vs State | vs National | |
| 1. | Philadelphia | 822 | 5,598(14.68%)#1 | 164,406(0.50%)#9 |
| 2. | Trexlertown | 228 | 5,598(4.07%)#2 | 164,406(0.14%)#88 |
| 3. | Pittsburgh | 163 | 5,598(2.91%)#3 | 164,406(0.10%)#130 |
| 4. | Leola | 155 | 5,598(2.77%)#4 | 164,406(0.09%)#142 |
| 5. | Levittown | 143 | 5,598(2.55%)#5 | 164,406(0.09%)#160 |
| 6. | Trappe Borough | 87 | 5,598(1.55%)#6 | 164,406(0.05%)#301 |
| 7. | Baldwin Borough | 66 | 5,598(1.18%)#7 | 164,406(0.04%)#416 |
| 8. | West Wyomissing | 64 | 5,598(1.14%)#8 | 164,406(0.04%)#429 |
| 9. | Reading | 61 | 5,598(1.09%)#9 | 164,406(0.04%)#443 |
| 10. | Fairless Hills | 56 | 5,598(1.00%)#10 | 164,406(0.03%)#486 |
| 11. | Wyomissing Borough | 54 | 5,598(0.96%)#11 | 164,406(0.03%)#502 |
| 12. | Erie | 51 | 5,598(0.91%)#12 | 164,406(0.03%)#527 |
| 13. | State College Borough | 47 | 5,598(0.84%)#13 | 164,406(0.03%)#585 |
| 14. | Pennside | 46 | 5,598(0.82%)#14 | 164,406(0.03%)#602 |
| 15. | Boiling Springs | 45 | 5,598(0.80%)#15 | 164,406(0.03%)#614 |
| 16. | Drexel Hill | 42 | 5,598(0.75%)#16 | 164,406(0.03%)#649 |
| 17. | Telford Borough | 40 | 5,598(0.71%)#17 | 164,406(0.02%)#683 |
| 18. | Bethel Park | 38 | 5,598(0.68%)#18 | 164,406(0.02%)#717 |
| 19. | Villanova | 37 | 5,598(0.66%)#19 | 164,406(0.02%)#745 |
| 20. | Bellefonte Borough | 37 | 5,598(0.66%)#20 | 164,406(0.02%)#748 |
| 21. | Roslyn | 36 | 5,598(0.64%)#21 | 164,406(0.02%)#766 |
| 22. | Northwest Harborcreek | 33 | 5,598(0.59%)#22 | 164,406(0.02%)#818 |
| 23. | Trooper | 33 | 5,598(0.59%)#23 | 164,406(0.02%)#820 |
| 24. | Glenolden Borough | 31 | 5,598(0.55%)#24 | 164,406(0.02%)#859 |
| 25. | Manchester Borough | 30 | 5,598(0.54%)#25 | 164,406(0.02%)#885 |
| 26. | Murrysville | 29 | 5,598(0.52%)#26 | 164,406(0.02%)#899 |
| 27. | Lower Allen | 29 | 5,598(0.52%)#27 | 164,406(0.02%)#902 |
| 28. | Reiffton | 29 | 5,598(0.52%)#28 | 164,406(0.02%)#906 |
| 29. | Hazleton | 28 | 5,598(0.50%)#29 | 164,406(0.02%)#927 |
| 30. | Audubon | 25 | 5,598(0.45%)#30 | 164,406(0.02%)#1,021 |
| 31. | Noblestown | 25 | 5,598(0.45%)#31 | 164,406(0.02%)#1,028 |
| 32. | Breinigsville | 24 | 5,598(0.43%)#32 | 164,406(0.01%)#1,048 |
| 33. | Hollidaysburg Borough | 23 | 5,598(0.41%)#33 | 164,406(0.01%)#1,079 |
| 34. | Whitfield | 21 | 5,598(0.38%)#34 | 164,406(0.01%)#1,138 |
| 35. | Mount Pleasant Borough | 20 | 5,598(0.36%)#35 | 164,406(0.01%)#1,174 |
| 36. | Sellersville Borough | 19 | 5,598(0.34%)#36 | 164,406(0.01%)#1,208 |
| 37. | Bethlehem | 18 | 5,598(0.32%)#37 | 164,406(0.01%)#1,217 |
| 38. | Spry | 18 | 5,598(0.32%)#38 | 164,406(0.01%)#1,255 |
| 39. | Charleroi Borough | 18 | 5,598(0.32%)#39 | 164,406(0.01%)#1,257 |
| 40. | Norristown Borough | 17 | 5,598(0.30%)#40 | 164,406(0.01%)#1,269 |
| 41. | Woodlyn | 17 | 5,598(0.30%)#41 | 164,406(0.01%)#1,288 |
| 42. | East Stroudsburg Borough | 17 | 5,598(0.30%)#42 | 164,406(0.01%)#1,289 |
| 43. | East Greenville Borough | 17 | 5,598(0.30%)#43 | 164,406(0.01%)#1,297 |
| 44. | Lancaster | 16 | 5,598(0.29%)#44 | 164,406(0.01%)#1,313 |
| 45. | Castle Shannon Borough | 16 | 5,598(0.29%)#45 | 164,406(0.01%)#1,350 |
| 46. | Lehighton Borough | 16 | 5,598(0.29%)#46 | 164,406(0.01%)#1,354 |
| 47. | Scranton | 14 | 5,598(0.25%)#47 | 164,406(0.01%)#1,413 |
| 48. | Homeacre Lyndora | 14 | 5,598(0.25%)#48 | 164,406(0.01%)#1,437 |
| 49. | New Kensington | 13 | 5,598(0.23%)#49 | 164,406(0.01%)#1,472 |
| 50. | Linglestown | 13 | 5,598(0.23%)#50 | 164,406(0.01%)#1,478 |
| 51. | Catasauqua Borough | 13 | 5,598(0.23%)#51 | 164,406(0.01%)#1,480 |
| 52. | Palmer Heights | 13 | 5,598(0.23%)#52 | 164,406(0.01%)#1,489 |
| 53. | Middletown | 12 | 5,598(0.21%)#53 | 164,406(0.01%)#1,524 |
| 54. | Oakmont Borough | 12 | 5,598(0.21%)#54 | 164,406(0.01%)#1,526 |
| 55. | Merion Station | 12 | 5,598(0.21%)#55 | 164,406(0.01%)#1,527 |
| 56. | Forty Fort Borough | 12 | 5,598(0.21%)#56 | 164,406(0.01%)#1,530 |
| 57. | Witmer | 12 | 5,598(0.21%)#57 | 164,406(0.01%)#1,541 |
| 58. | Easton | 11 | 5,598(0.20%)#58 | 164,406(0.01%)#1,562 |
| 59. | Nanticoke | 11 | 5,598(0.20%)#59 | 164,406(0.01%)#1,583 |
| 60. | Greensburg | 10 | 5,598(0.18%)#60 | 164,406(0.01%)#1,649 |
| 61. | Danville Borough | 10 | 5,598(0.18%)#61 | 164,406(0.01%)#1,664 |
| 62. | Millville Borough | 10 | 5,598(0.18%)#62 | 164,406(0.01%)#1,677 |
| 63. | Winfield | 10 | 5,598(0.18%)#63 | 164,406(0.01%)#1,678 |
| 64. | Sanatoga | 9 | 5,598(0.16%)#64 | 164,406(0.01%)#1,721 |
| 65. | Churchville | 9 | 5,598(0.16%)#65 | 164,406(0.01%)#1,723 |
| 66. | Norwood Borough | 9 | 5,598(0.16%)#66 | 164,406(0.01%)#1,725 |
| 67. | Laureldale Borough | 9 | 5,598(0.16%)#67 | 164,406(0.01%)#1,731 |
| 68. | Pen Argyl Borough | 9 | 5,598(0.16%)#68 | 164,406(0.01%)#1,734 |
| 69. | Hallam Borough | 9 | 5,598(0.16%)#69 | 164,406(0.01%)#1,736 |
| 70. | Spinnerstown | 9 | 5,598(0.16%)#70 | 164,406(0.01%)#1,738 |
| 71. | Bala Cynwyd | 8 | 5,598(0.14%)#71 | 164,406(0.00%)#1,784 |
| 72. | Folcroft Borough | 8 | 5,598(0.14%)#72 | 164,406(0.00%)#1,789 |
| 73. | New Britain Borough | 8 | 5,598(0.14%)#73 | 164,406(0.00%)#1,803 |
| 74. | Benton Borough | 8 | 5,598(0.14%)#74 | 164,406(0.00%)#1,817 |
| 75. | Clark Borough | 7 | 5,598(0.13%)#75 | 164,406(0.00%)#1,874 |
| 76. | Beaver Falls | 6 | 5,598(0.11%)#76 | 164,406(0.00%)#1,910 |
| 77. | Doylestown Borough | 6 | 5,598(0.11%)#77 | 164,406(0.00%)#1,911 |
| 78. | Royersford Borough | 6 | 5,598(0.11%)#78 | 164,406(0.00%)#1,917 |
| 79. | Wernersville Borough | 6 | 5,598(0.11%)#79 | 164,406(0.00%)#1,922 |
| 80. | Rockledge Borough | 6 | 5,598(0.11%)#80 | 164,406(0.00%)#1,924 |
| 81. | Ligonier Borough | 6 | 5,598(0.11%)#81 | 164,406(0.00%)#1,930 |
| 82. | Leetsdale Borough | 6 | 5,598(0.11%)#82 | 164,406(0.00%)#1,932 |
| 83. | Washington | 5 | 5,598(0.09%)#83 | 164,406(0.00%)#1,957 |
| 84. | Swissvale Borough | 5 | 5,598(0.09%)#84 | 164,406(0.00%)#1,963 |
| 85. | Coopersburg Borough | 5 | 5,598(0.09%)#85 | 164,406(0.00%)#1,975 |
| 86. | East Prospect Borough | 5 | 5,598(0.09%)#86 | 164,406(0.00%)#1,988 |
| 87. | Quakertown Borough | 4 | 5,598(0.07%)#87 | 164,406(0.00%)#2,003 |
| 88. | Youngsville Borough | 4 | 5,598(0.07%)#88 | 164,406(0.00%)#2,016 |
| 89. | Big Bass Lake | 4 | 5,598(0.07%)#89 | 164,406(0.00%)#2,017 |
| 90. | West Mayfield Borough | 4 | 5,598(0.07%)#90 | 164,406(0.00%)#2,019 |
| 91. | Tatamy Borough | 3 | 5,598(0.05%)#91 | 164,406(0.00%)#2,053 |
| 92. | Bear Creek Village Borough | 3 | 5,598(0.05%)#92 | 164,406(0.00%)#2,061 |
| 93. | Oxford Borough | 2 | 5,598(0.04%)#93 | 164,406(0.00%)#2,080 |
| 94. | Hyde Park | 2 | 5,598(0.04%)#94 | 164,406(0.00%)#2,083 |
| 95. | New Wilmington Borough | 2 | 5,598(0.04%)#95 | 164,406(0.00%)#2,084 |
| 96. | Lewis Run Borough | 2 | 5,598(0.04%)#96 | 164,406(0.00%)#2,100 |
| 97. | East Side Borough | 2 | 5,598(0.04%)#97 | 164,406(0.00%)#2,108 |
| 98. | Pottstown Borough | 1 | 5,598(0.02%)#98 | 164,406(0.00%)#2,120 |
| 99. | Collegeville Borough | 1 | 5,598(0.02%)#99 | 164,406(0.00%)#2,125 |
| 100. | Summit Hill Borough | 1 | 5,598(0.02%)#100 | 164,406(0.00%)#2,128 |
Common Questions
What are the Top 10 Cities with the Most Immigrants from Romania in Pennsylvania?
Top 10 Cities with the Most Immigrants from Romania in Pennsylvania are:
#1
822
#2
228
#3
163
#4
155
#5
143
#6
64
#7
61
#8
56
#9
51
#10
46
What city has the Most Immigrants from Romania in Pennsylvania?
Philadelphia has the Most Immigrants from Romania in Pennsylvania with 822.
What is the Total Immigrants from Romania in the State of Pennsylvania?
Total Immigrants from Romania in Pennsylvania is 5,598.
What is the Total Immigrants from Romania in the United States?
Total Immigrants from Romania in the United States is 164,406.