Cities with the Most Immigrants from Romania in Ohio
RELATED REPORTS & OPTIONS
Romania
Ohio
Compare Cities
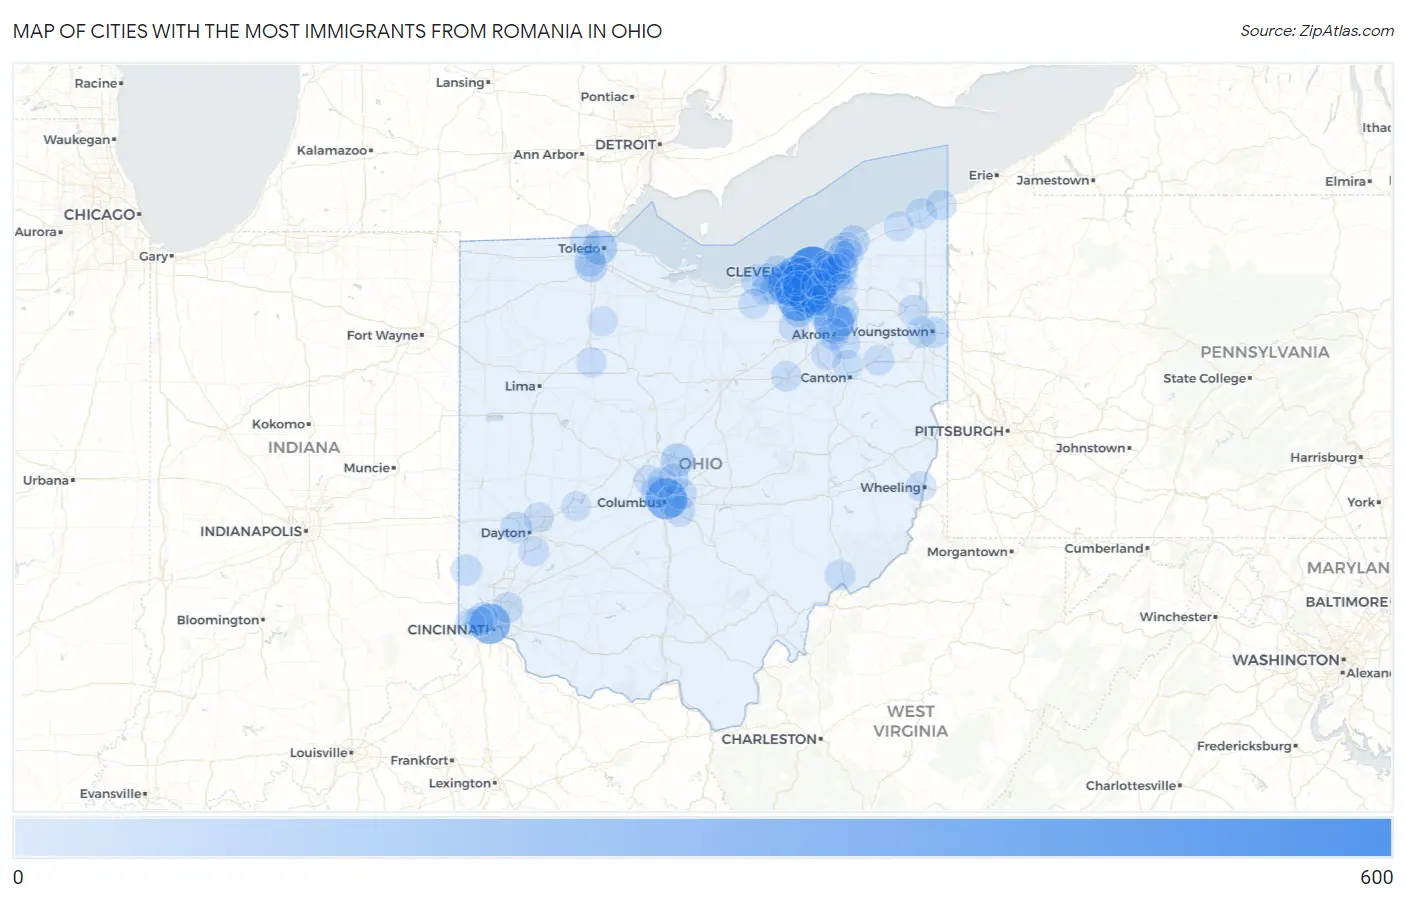
Map of Cities with the Most Immigrants from Romania in Ohio
0
600
Cities with the Most Immigrants from Romania in Ohio
| City | Romania | vs State | vs National | |
| 1. | Cleveland | 519 | 6,346(8.18%)#1 | 164,406(0.32%)#24 |
| 2. | Parma | 483 | 6,346(7.61%)#2 | 164,406(0.29%)#26 |
| 3. | Strongsville | 318 | 6,346(5.01%)#3 | 164,406(0.19%)#57 |
| 4. | Columbus | 283 | 6,346(4.46%)#4 | 164,406(0.17%)#67 |
| 5. | Cincinnati | 270 | 6,346(4.25%)#5 | 164,406(0.16%)#71 |
| 6. | Cuyahoga Falls | 256 | 6,346(4.03%)#6 | 164,406(0.16%)#76 |
| 7. | North Olmsted | 254 | 6,346(4.00%)#7 | 164,406(0.15%)#78 |
| 8. | Seven Hills | 251 | 6,346(3.96%)#8 | 164,406(0.15%)#79 |
| 9. | Rocky River | 203 | 6,346(3.20%)#9 | 164,406(0.12%)#103 |
| 10. | Westlake | 184 | 6,346(2.90%)#10 | 164,406(0.11%)#114 |
| 11. | Parma Heights | 160 | 6,346(2.52%)#11 | 164,406(0.10%)#133 |
| 12. | North Royalton | 130 | 6,346(2.05%)#12 | 164,406(0.08%)#185 |
| 13. | Brooklyn | 122 | 6,346(1.92%)#13 | 164,406(0.07%)#202 |
| 14. | Middleburg Heights | 114 | 6,346(1.80%)#14 | 164,406(0.07%)#220 |
| 15. | Toledo | 111 | 6,346(1.75%)#15 | 164,406(0.07%)#223 |
| 16. | Mayfield Heights | 86 | 6,346(1.36%)#16 | 164,406(0.05%)#306 |
| 17. | Brunswick | 84 | 6,346(1.32%)#17 | 164,406(0.05%)#312 |
| 18. | Sunbury | 84 | 6,346(1.32%)#18 | 164,406(0.05%)#317 |
| 19. | Shaker Heights | 73 | 6,346(1.15%)#19 | 164,406(0.04%)#364 |
| 20. | Lakewood | 72 | 6,346(1.13%)#20 | 164,406(0.04%)#367 |
| 21. | Beachwood | 71 | 6,346(1.12%)#21 | 164,406(0.04%)#378 |
| 22. | North Ridgeville | 66 | 6,346(1.04%)#22 | 164,406(0.04%)#413 |
| 23. | Hudson | 63 | 6,346(0.99%)#23 | 164,406(0.04%)#434 |
| 24. | Upper Arlington | 55 | 6,346(0.87%)#24 | 164,406(0.03%)#492 |
| 25. | Mentor | 48 | 6,346(0.76%)#25 | 164,406(0.03%)#567 |
| 26. | Perrysburg | 48 | 6,346(0.76%)#26 | 164,406(0.03%)#570 |
| 27. | Akron | 43 | 6,346(0.68%)#27 | 164,406(0.03%)#628 |
| 28. | Avon Lake | 37 | 6,346(0.58%)#28 | 164,406(0.02%)#735 |
| 29. | Brecksville | 36 | 6,346(0.57%)#29 | 164,406(0.02%)#762 |
| 30. | Maumee | 35 | 6,346(0.55%)#30 | 164,406(0.02%)#784 |
| 31. | Broadview Heights | 33 | 6,346(0.52%)#31 | 164,406(0.02%)#811 |
| 32. | Trotwood | 32 | 6,346(0.50%)#32 | 164,406(0.02%)#831 |
| 33. | Bexley | 32 | 6,346(0.50%)#33 | 164,406(0.02%)#832 |
| 34. | Oxford | 30 | 6,346(0.47%)#34 | 164,406(0.02%)#875 |
| 35. | Independence | 30 | 6,346(0.47%)#35 | 164,406(0.02%)#881 |
| 36. | Orange | 30 | 6,346(0.47%)#36 | 164,406(0.02%)#883 |
| 37. | Lorain | 29 | 6,346(0.46%)#37 | 164,406(0.02%)#891 |
| 38. | Willoughby | 29 | 6,346(0.46%)#38 | 164,406(0.02%)#898 |
| 39. | Gahanna | 28 | 6,346(0.44%)#39 | 164,406(0.02%)#924 |
| 40. | Blacklick Estates | 27 | 6,346(0.43%)#40 | 164,406(0.02%)#968 |
| 41. | Youngstown | 26 | 6,346(0.41%)#41 | 164,406(0.02%)#978 |
| 42. | Oakwood Village Cuyahoga County | 26 | 6,346(0.41%)#42 | 164,406(0.02%)#999 |
| 43. | Edgewood | 24 | 6,346(0.38%)#43 | 164,406(0.01%)#1,053 |
| 44. | Sheffield | 24 | 6,346(0.38%)#44 | 164,406(0.01%)#1,054 |
| 45. | Fairview Park | 22 | 6,346(0.35%)#45 | 164,406(0.01%)#1,100 |
| 46. | Blue Ash | 21 | 6,346(0.33%)#46 | 164,406(0.01%)#1,132 |
| 47. | Lakemore | 21 | 6,346(0.33%)#47 | 164,406(0.01%)#1,142 |
| 48. | Austintown | 20 | 6,346(0.32%)#48 | 164,406(0.01%)#1,150 |
| 49. | Willowick | 20 | 6,346(0.32%)#49 | 164,406(0.01%)#1,160 |
| 50. | University Heights | 20 | 6,346(0.32%)#50 | 164,406(0.01%)#1,161 |
| 51. | Elyria | 19 | 6,346(0.30%)#51 | 164,406(0.01%)#1,179 |
| 52. | Westerville | 19 | 6,346(0.30%)#52 | 164,406(0.01%)#1,183 |
| 53. | Garfield Heights | 18 | 6,346(0.28%)#53 | 164,406(0.01%)#1,230 |
| 54. | Olmsted Falls | 17 | 6,346(0.27%)#54 | 164,406(0.01%)#1,290 |
| 55. | Mayfield | 17 | 6,346(0.27%)#55 | 164,406(0.01%)#1,296 |
| 56. | Devola | 17 | 6,346(0.27%)#56 | 164,406(0.01%)#1,301 |
| 57. | Alliance | 16 | 6,346(0.25%)#57 | 164,406(0.01%)#1,334 |
| 58. | Sylvania | 16 | 6,346(0.25%)#58 | 164,406(0.01%)#1,335 |
| 59. | Monfort Heights | 16 | 6,346(0.25%)#59 | 164,406(0.01%)#1,346 |
| 60. | Oberlin | 16 | 6,346(0.25%)#60 | 164,406(0.01%)#1,351 |
| 61. | Cleveland Heights | 15 | 6,346(0.24%)#61 | 164,406(0.01%)#1,379 |
| 62. | Conneaut | 15 | 6,346(0.24%)#62 | 164,406(0.01%)#1,393 |
| 63. | Warren | 13 | 6,346(0.20%)#63 | 164,406(0.01%)#1,456 |
| 64. | Wooster | 13 | 6,346(0.20%)#64 | 164,406(0.01%)#1,459 |
| 65. | Medina | 13 | 6,346(0.20%)#65 | 164,406(0.01%)#1,460 |
| 66. | Huber Heights | 12 | 6,346(0.19%)#66 | 164,406(0.01%)#1,506 |
| 67. | Stow | 11 | 6,346(0.17%)#67 | 164,406(0.01%)#1,559 |
| 68. | Arlington | 11 | 6,346(0.17%)#68 | 164,406(0.01%)#1,604 |
| 69. | Centerville | 10 | 6,346(0.16%)#69 | 164,406(0.01%)#1,640 |
| 70. | Brook Park | 10 | 6,346(0.16%)#70 | 164,406(0.01%)#1,646 |
| 71. | East Cleveland | 10 | 6,346(0.16%)#71 | 164,406(0.01%)#1,650 |
| 72. | Bridgetown | 10 | 6,346(0.16%)#72 | 164,406(0.01%)#1,652 |
| 73. | Willoughby Hills | 10 | 6,346(0.16%)#73 | 164,406(0.01%)#1,658 |
| 74. | Bridgeport | 10 | 6,346(0.16%)#74 | 164,406(0.01%)#1,674 |
| 75. | Dublin | 9 | 6,346(0.14%)#75 | 164,406(0.01%)#1,692 |
| 76. | Worthington | 9 | 6,346(0.14%)#76 | 164,406(0.01%)#1,714 |
| 77. | Brooklyn Heights | 8 | 6,346(0.13%)#77 | 164,406(0.00%)#1,813 |
| 78. | Lyndhurst | 7 | 6,346(0.11%)#78 | 164,406(0.00%)#1,847 |
| 79. | New Franklin | 6 | 6,346(0.09%)#79 | 164,406(0.00%)#1,906 |
| 80. | Richfield | 6 | 6,346(0.09%)#80 | 164,406(0.00%)#1,919 |
| 81. | North Canton | 5 | 6,346(0.08%)#81 | 164,406(0.00%)#1,951 |
| 82. | Springfield | 4 | 6,346(0.06%)#82 | 164,406(0.00%)#1,995 |
| 83. | Solon | 4 | 6,346(0.06%)#83 | 164,406(0.00%)#1,999 |
| 84. | Waite Hill | 3 | 6,346(0.05%)#84 | 164,406(0.00%)#2,059 |
| 85. | Geneva | 2 | 6,346(0.03%)#85 | 164,406(0.00%)#2,078 |
| 86. | Addyston | 1 | 6,346(0.02%)#86 | 164,406(0.00%)#2,137 |
| 87. | Bloomdale | 1 | 6,346(0.02%)#87 | 164,406(0.00%)#2,142 |
Common Questions
What are the Top 10 Cities with the Most Immigrants from Romania in Ohio?
Top 10 Cities with the Most Immigrants from Romania in Ohio are:
#1
519
#2
483
#3
318
#4
283
#5
270
#6
256
#7
254
#8
251
#9
203
#10
184
What city has the Most Immigrants from Romania in Ohio?
Cleveland has the Most Immigrants from Romania in Ohio with 519.
What is the Total Immigrants from Romania in the State of Ohio?
Total Immigrants from Romania in Ohio is 6,346.
What is the Total Immigrants from Romania in the United States?
Total Immigrants from Romania in the United States is 164,406.