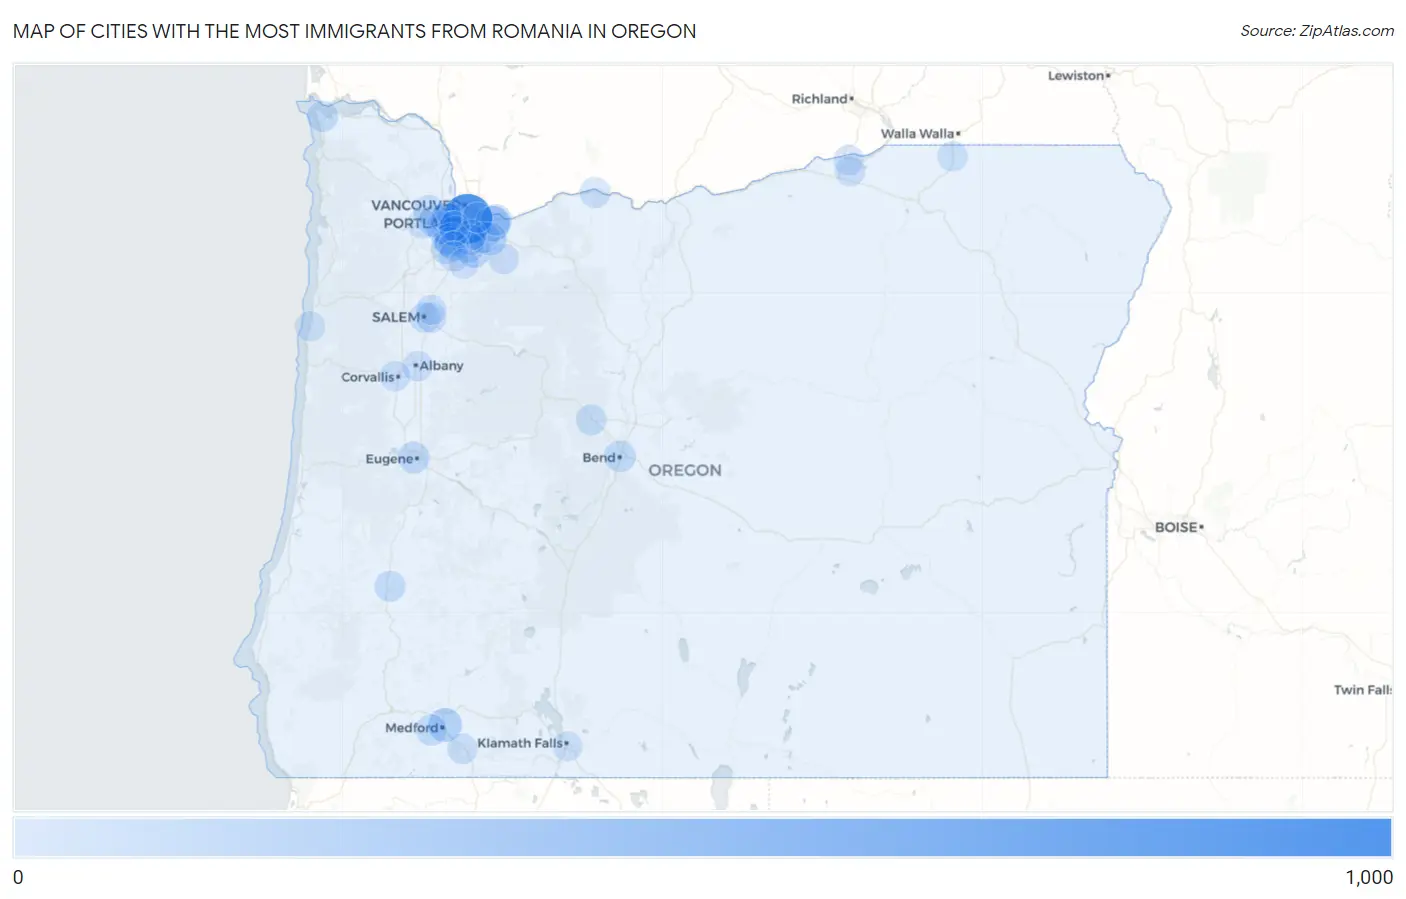
Cities with the Most Immigrants from Romania in Oregon
RELATED REPORTS & OPTIONS
Romania
Oregon
Compare Cities
Map of Cities with the Most Immigrants from Romania in Oregon
0
1,000
Cities with the Most Immigrants from Romania in Oregon
| City | Romania | vs State | vs National | |
| 1. | Portland | 976 | 4,043(24.14%)#1 | 164,406(0.59%)#5 |
| 2. | Gresham | 256 | 4,043(6.33%)#2 | 164,406(0.16%)#75 |
| 3. | Medford | 181 | 4,043(4.48%)#3 | 164,406(0.11%)#116 |
| 4. | Beaverton | 180 | 4,043(4.45%)#4 | 164,406(0.11%)#119 |
| 5. | Oregon City | 140 | 4,043(3.46%)#5 | 164,406(0.09%)#166 |
| 6. | Damascus | 139 | 4,043(3.44%)#6 | 164,406(0.08%)#168 |
| 7. | Aloha | 121 | 4,043(2.99%)#7 | 164,406(0.07%)#204 |
| 8. | Hillsboro | 120 | 4,043(2.97%)#8 | 164,406(0.07%)#205 |
| 9. | Oak Hills | 88 | 4,043(2.18%)#9 | 164,406(0.05%)#296 |
| 10. | Tigard | 83 | 4,043(2.05%)#10 | 164,406(0.05%)#320 |
| 11. | Eugene | 81 | 4,043(2.00%)#11 | 164,406(0.05%)#328 |
| 12. | Happy Valley | 72 | 4,043(1.78%)#12 | 164,406(0.04%)#370 |
| 13. | Bend | 67 | 4,043(1.66%)#13 | 164,406(0.04%)#401 |
| 14. | Troutdale | 58 | 4,043(1.43%)#14 | 164,406(0.04%)#468 |
| 15. | Jacksonville | 55 | 4,043(1.36%)#15 | 164,406(0.03%)#496 |
| 16. | Bull Mountain | 50 | 4,043(1.24%)#16 | 164,406(0.03%)#552 |
| 17. | Warrenton | 49 | 4,043(1.21%)#17 | 164,406(0.03%)#558 |
| 18. | Roseburg | 42 | 4,043(1.04%)#18 | 164,406(0.03%)#650 |
| 19. | West Linn | 41 | 4,043(1.01%)#19 | 164,406(0.02%)#665 |
| 20. | Sherwood | 39 | 4,043(0.96%)#20 | 164,406(0.02%)#702 |
| 21. | King City | 34 | 4,043(0.84%)#21 | 164,406(0.02%)#800 |
| 22. | Sisters | 30 | 4,043(0.74%)#22 | 164,406(0.02%)#884 |
| 23. | Oak Grove | 27 | 4,043(0.67%)#23 | 164,406(0.02%)#961 |
| 24. | Hood River | 25 | 4,043(0.62%)#24 | 164,406(0.02%)#1,022 |
| 25. | Salem | 24 | 4,043(0.59%)#25 | 164,406(0.01%)#1,030 |
| 26. | Milwaukie | 23 | 4,043(0.57%)#26 | 164,406(0.01%)#1,068 |
| 27. | Umatilla | 22 | 4,043(0.54%)#27 | 164,406(0.01%)#1,108 |
| 28. | Estacada | 21 | 4,043(0.52%)#28 | 164,406(0.01%)#1,139 |
| 29. | Garden Home Whitford | 19 | 4,043(0.47%)#29 | 164,406(0.01%)#1,206 |
| 30. | Albany | 16 | 4,043(0.40%)#30 | 164,406(0.01%)#1,314 |
| 31. | Four Corners | 16 | 4,043(0.40%)#31 | 164,406(0.01%)#1,341 |
| 32. | Bethany | 14 | 4,043(0.35%)#32 | 164,406(0.01%)#1,421 |
| 33. | West Slope | 13 | 4,043(0.32%)#33 | 164,406(0.01%)#1,479 |
| 34. | Corvallis | 12 | 4,043(0.30%)#34 | 164,406(0.01%)#1,501 |
| 35. | Ashland | 12 | 4,043(0.30%)#35 | 164,406(0.01%)#1,511 |
| 36. | Milton Freewater | 11 | 4,043(0.27%)#36 | 164,406(0.01%)#1,592 |
| 37. | Maywood Park | 10 | 4,043(0.25%)#37 | 164,406(0.01%)#1,676 |
| 38. | Cherry Grove | 10 | 4,043(0.25%)#38 | 164,406(0.01%)#1,679 |
| 39. | North Plains | 9 | 4,043(0.22%)#39 | 164,406(0.01%)#1,735 |
| 40. | Tualatin | 5 | 4,043(0.12%)#40 | 164,406(0.00%)#1,946 |
| 41. | Wilsonville | 5 | 4,043(0.12%)#41 | 164,406(0.00%)#1,947 |
| 42. | Klamath Falls | 5 | 4,043(0.12%)#42 | 164,406(0.00%)#1,949 |
| 43. | Cornelius | 5 | 4,043(0.12%)#43 | 164,406(0.00%)#1,958 |
| 44. | Hayesville | 3 | 4,043(0.07%)#44 | 164,406(0.00%)#2,034 |
| 45. | Canby | 3 | 4,043(0.07%)#45 | 164,406(0.00%)#2,036 |
| 46. | Hermiston | 2 | 4,043(0.05%)#46 | 164,406(0.00%)#2,069 |
| 47. | Lincoln Beach | 1 | 4,043(0.02%)#47 | 164,406(0.00%)#2,129 |
Common Questions
What are the Top 10 Cities with the Most Immigrants from Romania in Oregon?
Top 10 Cities with the Most Immigrants from Romania in Oregon are:
What city has the Most Immigrants from Romania in Oregon?
Portland has the Most Immigrants from Romania in Oregon with 976.
What is the Total Immigrants from Romania in the State of Oregon?
Total Immigrants from Romania in Oregon is 4,043.
What is the Total Immigrants from Romania in the United States?
Total Immigrants from Romania in the United States is 164,406.