Cities with the Largest Egyptian Community in the United States
RELATED REPORTS & OPTIONS
Egyptian
United States
Compare Cities
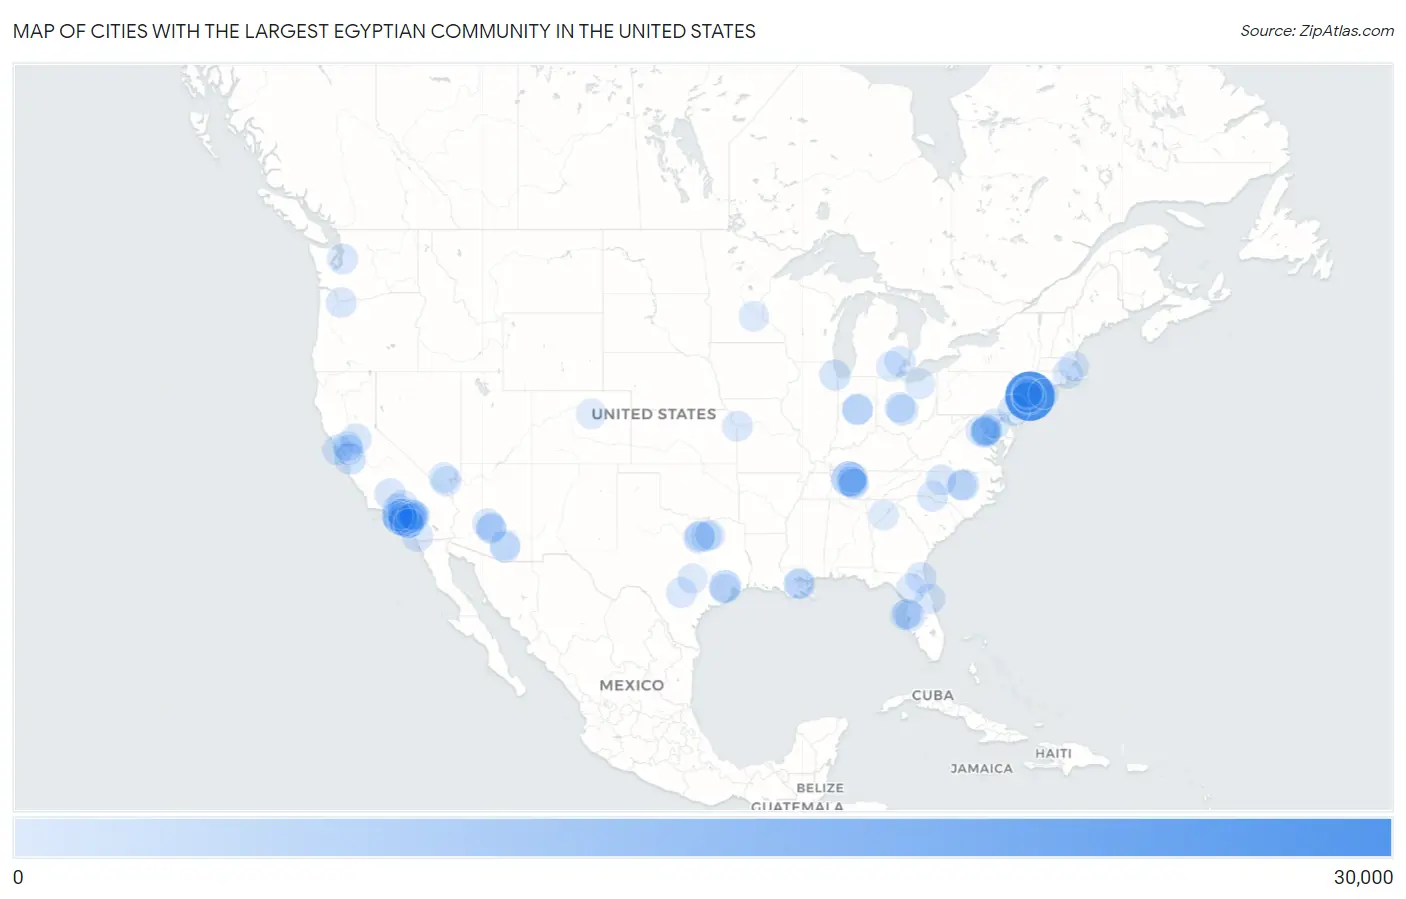
Map of Cities with the Largest Egyptian Community in the United States
0
30,000
Cities with the Largest Egyptian Community in the United States
| City | Egyptian | vs State | vs National | |
| 1. | New York | 29,498 | 39,303(75.05%)#1 | 309,357(9.54%)#1 |
| 2. | Nashville | 7,153 | 13,028(54.90%)#1 | 309,357(2.31%)#2 |
| 3. | Los Angeles | 6,416 | 58,380(10.99%)#1 | 309,357(2.07%)#3 |
| 4. | Bayonne | 5,781 | 46,159(12.52%)#1 | 309,357(1.87%)#4 |
| 5. | Jersey City | 5,387 | 46,159(11.67%)#2 | 309,357(1.74%)#5 |
| 6. | Houston | 3,405 | 19,434(17.52%)#1 | 309,357(1.10%)#6 |
| 7. | San Jose | 2,250 | 58,380(3.85%)#2 | 309,357(0.73%)#7 |
| 8. | Philadelphia | 2,075 | 11,474(18.08%)#1 | 309,357(0.67%)#8 |
| 9. | Columbus | 1,781 | 7,944(22.42%)#1 | 309,357(0.58%)#9 |
| 10. | Raleigh | 1,727 | 7,030(24.57%)#1 | 309,357(0.56%)#10 |
| 11. | Chicago | 1,705 | 8,530(19.99%)#1 | 309,357(0.55%)#11 |
| 12. | Fort Worth | 1,630 | 19,434(8.39%)#2 | 309,357(0.53%)#12 |
| 13. | Irvine | 1,457 | 58,380(2.50%)#3 | 309,357(0.47%)#13 |
| 14. | San Diego | 1,402 | 58,380(2.40%)#4 | 309,357(0.45%)#14 |
| 15. | Anaheim | 1,364 | 58,380(2.34%)#5 | 309,357(0.44%)#15 |
| 16. | Bakersfield | 1,275 | 58,380(2.18%)#6 | 309,357(0.41%)#16 |
| 17. | Centreville | 1,231 | 12,846(9.58%)#1 | 309,357(0.40%)#17 |
| 18. | Smyrna | 1,100 | 13,028(8.44%)#2 | 309,357(0.36%)#18 |
| 19. | Jacksonville | 1,098 | 17,814(6.16%)#1 | 309,357(0.35%)#19 |
| 20. | Fountain Valley | 1,078 | 58,380(1.85%)#7 | 309,357(0.35%)#20 |
| 21. | San Francisco | 1,002 | 58,380(1.72%)#8 | 309,357(0.32%)#21 |
| 22. | Clifton | 938 | 46,159(2.03%)#3 | 309,357(0.30%)#22 |
| 23. | Westfield | 913 | 3,027(30.16%)#1 | 309,357(0.30%)#23 |
| 24. | Dublin | 902 | 7,944(11.35%)#2 | 309,357(0.29%)#24 |
| 25. | Huntington Beach | 856 | 58,380(1.47%)#9 | 309,357(0.28%)#25 |
| 26. | Tinton Falls Borough | 854 | 46,159(1.85%)#4 | 309,357(0.28%)#26 |
| 27. | Elk Grove | 821 | 58,380(1.41%)#10 | 309,357(0.27%)#27 |
| 28. | Dallas | 812 | 19,434(4.18%)#3 | 309,357(0.26%)#28 |
| 29. | Sayreville Borough | 810 | 46,159(1.75%)#5 | 309,357(0.26%)#29 |
| 30. | Santa Clarita | 793 | 58,380(1.36%)#11 | 309,357(0.26%)#30 |
| 31. | Troy | 792 | 5,525(14.33%)#1 | 309,357(0.26%)#31 |
| 32. | El Sobrante Cdp Riverside County | 771 | 58,380(1.32%)#12 | 309,357(0.25%)#32 |
| 33. | Gresham | 766 | 2,110(36.30%)#1 | 309,357(0.25%)#33 |
| 34. | Seattle | 758 | 4,881(15.53%)#1 | 309,357(0.25%)#34 |
| 35. | Lake Forest | 758 | 58,380(1.30%)#13 | 309,357(0.25%)#35 |
| 36. | San Antonio | 756 | 19,434(3.89%)#4 | 309,357(0.24%)#36 |
| 37. | Mount Juliet | 750 | 13,028(5.76%)#3 | 309,357(0.24%)#37 |
| 38. | Charlotte | 734 | 7,030(10.44%)#2 | 309,357(0.24%)#38 |
| 39. | La Vergne | 731 | 13,028(5.61%)#4 | 309,357(0.24%)#39 |
| 40. | Phoenix | 725 | 3,893(18.62%)#1 | 309,357(0.23%)#40 |
| 41. | Port Orange | 719 | 17,814(4.04%)#2 | 309,357(0.23%)#41 |
| 42. | Metairie | 718 | 2,253(31.87%)#1 | 309,357(0.23%)#42 |
| 43. | Winston Salem | 714 | 7,030(10.16%)#3 | 309,357(0.23%)#43 |
| 44. | North Richland Hills | 701 | 19,434(3.61%)#5 | 309,357(0.23%)#44 |
| 45. | San Ramon | 694 | 58,380(1.19%)#14 | 309,357(0.22%)#45 |
| 46. | Kansas City | 693 | 2,034(34.07%)#1 | 309,357(0.22%)#46 |
| 47. | Fontana | 690 | 58,380(1.18%)#15 | 309,357(0.22%)#47 |
| 48. | Carmel | 687 | 3,027(22.70%)#2 | 309,357(0.22%)#48 |
| 49. | Long Beach | 667 | 58,380(1.14%)#16 | 309,357(0.22%)#49 |
| 50. | Tampa | 647 | 17,814(3.63%)#3 | 309,357(0.21%)#50 |
| 51. | Torrance | 636 | 58,380(1.09%)#17 | 309,357(0.21%)#51 |
| 52. | Rancho Cucamonga | 633 | 58,380(1.08%)#18 | 309,357(0.20%)#52 |
| 53. | Washington | 613 | 613(100.00%)#1 | 309,357(0.20%)#53 |
| 54. | Elizabeth | 612 | 46,159(1.33%)#6 | 309,357(0.20%)#54 |
| 55. | Glendale | 605 | 58,380(1.04%)#19 | 309,357(0.20%)#55 |
| 56. | Palm Harbor | 604 | 17,814(3.39%)#4 | 309,357(0.20%)#56 |
| 57. | Westminster | 597 | 58,380(1.02%)#20 | 309,357(0.19%)#57 |
| 58. | Lancaster | 580 | 58,380(0.99%)#21 | 309,357(0.19%)#58 |
| 59. | Eden Prairie | 579 | 3,910(14.81%)#1 | 309,357(0.19%)#59 |
| 60. | Union Beach Borough | 576 | 46,159(1.25%)#7 | 309,357(0.19%)#60 |
| 61. | Gainesville | 571 | 17,814(3.21%)#5 | 309,357(0.18%)#61 |
| 62. | Pasadena | 567 | 58,380(0.97%)#22 | 309,357(0.18%)#62 |
| 63. | Denver | 561 | 1,969(28.49%)#1 | 309,357(0.18%)#63 |
| 64. | Murfreesboro | 556 | 13,028(4.27%)#5 | 309,357(0.18%)#64 |
| 65. | Corona | 545 | 58,380(0.93%)#23 | 309,357(0.18%)#65 |
| 66. | Paterson | 544 | 46,159(1.18%)#8 | 309,357(0.18%)#66 |
| 67. | Morrisville | 544 | 7,030(7.74%)#4 | 309,357(0.18%)#67 |
| 68. | Alpharetta | 541 | 5,022(10.77%)#1 | 309,357(0.17%)#68 |
| 69. | Tucson | 523 | 3,893(13.43%)#2 | 309,357(0.17%)#69 |
| 70. | Bridgeport Borough | 522 | 11,474(4.55%)#2 | 309,357(0.17%)#70 |
| 71. | Rialto | 514 | 58,380(0.88%)#24 | 309,357(0.17%)#71 |
| 72. | Austin | 511 | 19,434(2.63%)#6 | 309,357(0.17%)#72 |
| 73. | Pawtucket | 510 | 1,105(46.15%)#1 | 309,357(0.16%)#73 |
| 74. | Milltown Borough | 503 | 46,159(1.09%)#9 | 309,357(0.16%)#74 |
| 75. | Boston | 491 | 6,869(7.15%)#1 | 309,357(0.16%)#75 |
| 76. | Arlington | 482 | 12,846(3.75%)#2 | 309,357(0.16%)#76 |
| 77. | Kenner | 480 | 2,253(21.30%)#2 | 309,357(0.16%)#77 |
| 78. | Preakness | 480 | 46,159(1.04%)#10 | 309,357(0.16%)#78 |
| 79. | Trinity | 476 | 17,814(2.67%)#6 | 309,357(0.15%)#79 |
| 80. | Tempe | 473 | 3,893(12.15%)#3 | 309,357(0.15%)#80 |
| 81. | Loma Linda | 473 | 58,380(0.81%)#25 | 309,357(0.15%)#81 |
| 82. | Bellaire | 454 | 19,434(2.34%)#7 | 309,357(0.15%)#82 |
| 83. | Catalina Foothills | 453 | 3,893(11.64%)#4 | 309,357(0.15%)#83 |
| 84. | Middlesex Borough | 447 | 46,159(0.97%)#11 | 309,357(0.14%)#84 |
| 85. | Riverside | 445 | 58,380(0.76%)#26 | 309,357(0.14%)#85 |
| 86. | Downey | 443 | 58,380(0.76%)#27 | 309,357(0.14%)#86 |
| 87. | Santa Monica | 433 | 58,380(0.74%)#28 | 309,357(0.14%)#87 |
| 88. | Coram | 432 | 39,303(1.10%)#2 | 309,357(0.14%)#88 |
| 89. | Alexandria | 431 | 12,846(3.36%)#3 | 309,357(0.14%)#89 |
| 90. | Las Vegas | 425 | 1,593(26.68%)#1 | 309,357(0.14%)#90 |
| 91. | Mission Viejo | 425 | 58,380(0.73%)#29 | 309,357(0.14%)#91 |
| 92. | Dundalk | 422 | 6,846(6.16%)#1 | 309,357(0.14%)#92 |
| 93. | Parma | 421 | 7,944(5.30%)#3 | 309,357(0.14%)#93 |
| 94. | Fairview Borough | 419 | 46,159(0.91%)#12 | 309,357(0.14%)#94 |
| 95. | Henderson | 417 | 1,593(26.18%)#2 | 309,357(0.13%)#95 |
| 96. | Kingstowne | 414 | 12,846(3.22%)#4 | 309,357(0.13%)#96 |
| 97. | Concord | 408 | 58,380(0.70%)#30 | 309,357(0.13%)#97 |
| 98. | Chandler | 406 | 3,893(10.43%)#5 | 309,357(0.13%)#98 |
| 99. | Ann Arbor | 406 | 5,525(7.35%)#2 | 309,357(0.13%)#99 |
| 100. | Rowlett | 403 | 19,434(2.07%)#8 | 309,357(0.13%)#100 |
Common Questions
What are the Top 10 Cities with the Largest Egyptian Community in the United States?
Top 10 Cities with the Largest Egyptian Community in the United States are:
What city has the Largest Egyptian Community in the United States?
New York has the Largest Egyptian Community in the United States with 29,498.
What is the Total Egyptian Population in the United States?
Total Egyptian Population in the United States is 309,357.