Cities with the Largest Egyptian Community in New York
RELATED REPORTS & OPTIONS
Egyptian
New York
Compare Cities
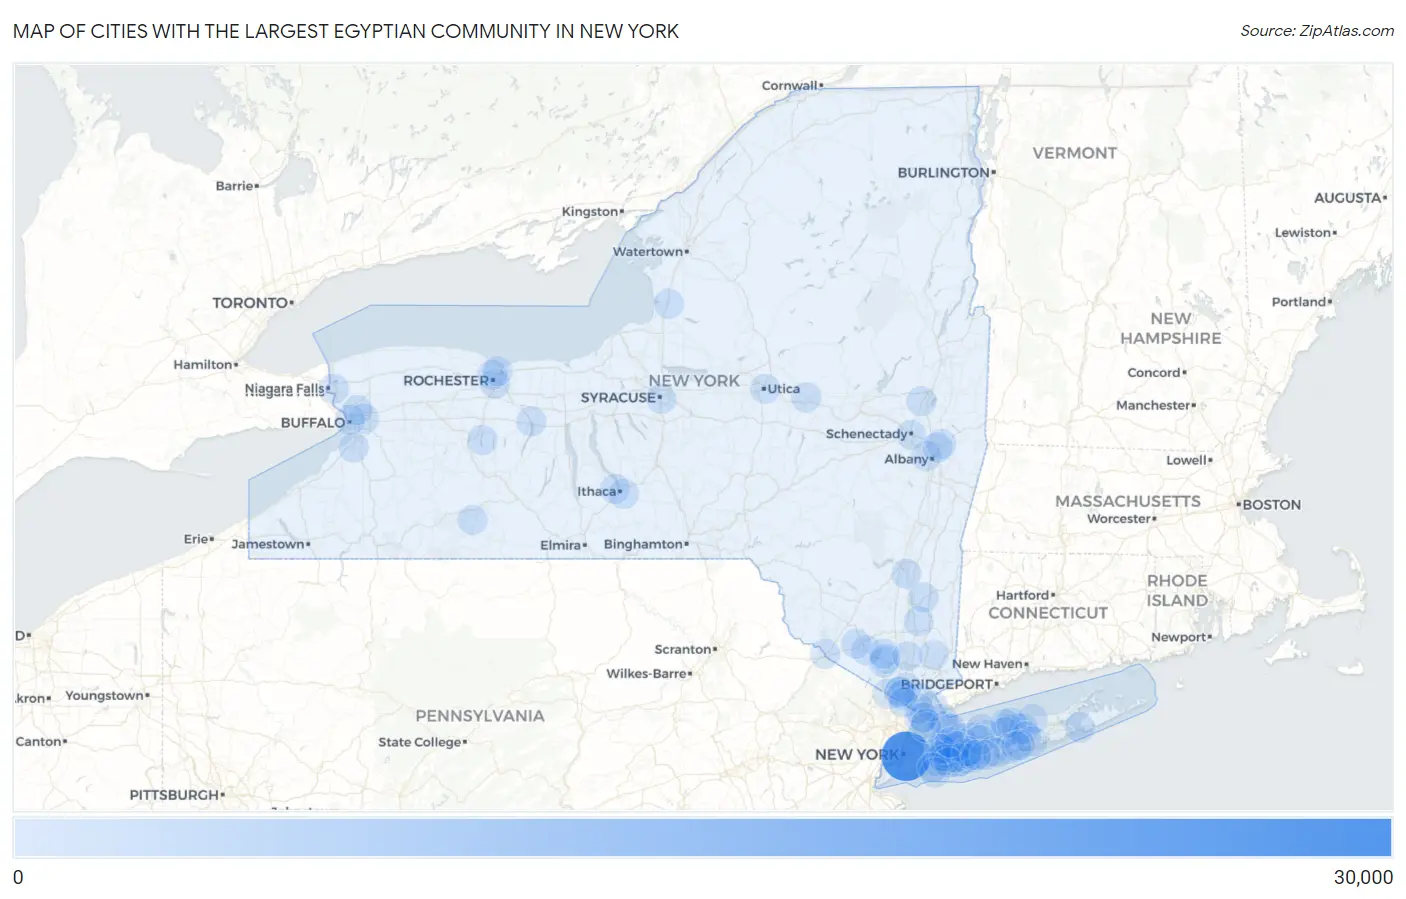
Map of Cities with the Largest Egyptian Community in New York
0
30,000
Cities with the Largest Egyptian Community in New York
| City | Egyptian | vs State | vs National | |
| 1. | New York | 29,498 | 39,303(75.05%)#1 | 309,357(9.54%)#1 |
| 2. | Coram | 432 | 39,303(1.10%)#2 | 309,357(0.14%)#88 |
| 3. | Glen Cove | 329 | 39,303(0.84%)#3 | 309,357(0.11%)#142 |
| 4. | Roessleville | 310 | 39,303(0.79%)#4 | 309,357(0.10%)#153 |
| 5. | Yonkers | 252 | 39,303(0.64%)#5 | 309,357(0.08%)#195 |
| 6. | New Cassel | 180 | 39,303(0.46%)#6 | 309,357(0.06%)#301 |
| 7. | Syosset | 179 | 39,303(0.46%)#7 | 309,357(0.06%)#302 |
| 8. | Centereach | 167 | 39,303(0.42%)#8 | 309,357(0.05%)#328 |
| 9. | Searingtown | 159 | 39,303(0.40%)#9 | 309,357(0.05%)#346 |
| 10. | Rye | 158 | 39,303(0.40%)#10 | 309,357(0.05%)#349 |
| 11. | Canandaigua | 155 | 39,303(0.39%)#11 | 309,357(0.05%)#357 |
| 12. | Goshen | 144 | 39,303(0.37%)#12 | 309,357(0.05%)#382 |
| 13. | Brighton | 143 | 39,303(0.36%)#13 | 309,357(0.05%)#385 |
| 14. | Bellmore | 142 | 39,303(0.36%)#14 | 309,357(0.05%)#391 |
| 15. | Hamburg | 132 | 39,303(0.34%)#15 | 309,357(0.04%)#414 |
| 16. | Syracuse | 131 | 39,303(0.33%)#16 | 309,357(0.04%)#415 |
| 17. | Valley Stream | 119 | 39,303(0.30%)#17 | 309,357(0.04%)#449 |
| 18. | Cheektowaga | 115 | 39,303(0.29%)#18 | 309,357(0.04%)#463 |
| 19. | Lake Grove | 113 | 39,303(0.29%)#19 | 309,357(0.04%)#469 |
| 20. | Sleepy Hollow | 110 | 39,303(0.28%)#20 | 309,357(0.04%)#480 |
| 21. | South Huntington | 110 | 39,303(0.28%)#21 | 309,357(0.04%)#481 |
| 22. | Sayville | 106 | 39,303(0.27%)#22 | 309,357(0.03%)#496 |
| 23. | Plainview | 101 | 39,303(0.26%)#23 | 309,357(0.03%)#514 |
| 24. | Middle Island | 100 | 39,303(0.25%)#24 | 309,357(0.03%)#520 |
| 25. | Monroe | 98 | 39,303(0.25%)#25 | 309,357(0.03%)#528 |
| 26. | Albany | 95 | 39,303(0.24%)#26 | 309,357(0.03%)#538 |
| 27. | Commack | 93 | 39,303(0.24%)#27 | 309,357(0.03%)#551 |
| 28. | Little Falls | 90 | 39,303(0.23%)#28 | 309,357(0.03%)#564 |
| 29. | Garden City | 89 | 39,303(0.23%)#29 | 309,357(0.03%)#569 |
| 30. | Mahopac | 82 | 39,303(0.21%)#30 | 309,357(0.03%)#608 |
| 31. | Schenectady | 78 | 39,303(0.20%)#31 | 309,357(0.03%)#633 |
| 32. | Buffalo | 77 | 39,303(0.20%)#32 | 309,357(0.02%)#637 |
| 33. | Wantagh | 77 | 39,303(0.20%)#33 | 309,357(0.02%)#642 |
| 34. | White Plains | 71 | 39,303(0.18%)#34 | 309,357(0.02%)#682 |
| 35. | Kiryas Joel | 68 | 39,303(0.17%)#35 | 309,357(0.02%)#711 |
| 36. | Salisbury | 67 | 39,303(0.17%)#36 | 309,357(0.02%)#726 |
| 37. | Franklin Square | 63 | 39,303(0.16%)#37 | 309,357(0.02%)#759 |
| 38. | North Merrick | 62 | 39,303(0.16%)#38 | 309,357(0.02%)#773 |
| 39. | East Shoreham | 62 | 39,303(0.16%)#39 | 309,357(0.02%)#775 |
| 40. | Niagara Falls | 58 | 39,303(0.15%)#40 | 309,357(0.02%)#811 |
| 41. | West Hempstead | 58 | 39,303(0.15%)#41 | 309,357(0.02%)#812 |
| 42. | Port Jefferson Station | 56 | 39,303(0.14%)#42 | 309,357(0.02%)#838 |
| 43. | Lindenhurst | 53 | 39,303(0.13%)#43 | 309,357(0.02%)#854 |
| 44. | North Bellmore | 52 | 39,303(0.13%)#44 | 309,357(0.02%)#869 |
| 45. | North Amityville | 51 | 39,303(0.13%)#45 | 309,357(0.02%)#878 |
| 46. | North Ballston Spa | 51 | 39,303(0.13%)#46 | 309,357(0.02%)#880 |
| 47. | East Northport | 47 | 39,303(0.12%)#47 | 309,357(0.02%)#916 |
| 48. | Massapequa Park | 46 | 39,303(0.12%)#48 | 309,357(0.01%)#928 |
| 49. | Garden City Park | 46 | 39,303(0.12%)#49 | 309,357(0.01%)#930 |
| 50. | Suffern | 45 | 39,303(0.11%)#50 | 309,357(0.01%)#946 |
| 51. | Rochester | 43 | 39,303(0.11%)#51 | 309,357(0.01%)#969 |
| 52. | Mineola | 41 | 39,303(0.10%)#52 | 309,357(0.01%)#1,007 |
| 53. | Pelham Manor | 41 | 39,303(0.10%)#53 | 309,357(0.01%)#1,013 |
| 54. | Spring Valley | 40 | 39,303(0.10%)#54 | 309,357(0.01%)#1,019 |
| 55. | Rockville Centre | 40 | 39,303(0.10%)#55 | 309,357(0.01%)#1,022 |
| 56. | East Ithaca | 40 | 39,303(0.10%)#56 | 309,357(0.01%)#1,031 |
| 57. | Troy | 38 | 39,303(0.10%)#57 | 309,357(0.01%)#1,058 |
| 58. | Hicksville | 38 | 39,303(0.10%)#58 | 309,357(0.01%)#1,059 |
| 59. | Stony Brook University | 38 | 39,303(0.10%)#59 | 309,357(0.01%)#1,069 |
| 60. | Islip | 36 | 39,303(0.09%)#60 | 309,357(0.01%)#1,101 |
| 61. | Dobbs Ferry | 36 | 39,303(0.09%)#61 | 309,357(0.01%)#1,103 |
| 62. | Dix Hills | 34 | 39,303(0.09%)#62 | 309,357(0.01%)#1,139 |
| 63. | Utica | 33 | 39,303(0.08%)#63 | 309,357(0.01%)#1,153 |
| 64. | Shirley | 33 | 39,303(0.08%)#64 | 309,357(0.01%)#1,162 |
| 65. | South Farmingdale | 33 | 39,303(0.08%)#65 | 309,357(0.01%)#1,164 |
| 66. | East Islip | 33 | 39,303(0.08%)#66 | 309,357(0.01%)#1,165 |
| 67. | Yaphank | 31 | 39,303(0.08%)#67 | 309,357(0.01%)#1,191 |
| 68. | Patchogue | 30 | 39,303(0.08%)#68 | 309,357(0.01%)#1,214 |
| 69. | Myers Corner | 30 | 39,303(0.08%)#69 | 309,357(0.01%)#1,216 |
| 70. | Port Jervis | 30 | 39,303(0.08%)#70 | 309,357(0.01%)#1,219 |
| 71. | Pelham | 30 | 39,303(0.08%)#71 | 309,357(0.01%)#1,221 |
| 72. | Tuckahoe | 30 | 39,303(0.08%)#72 | 309,357(0.01%)#1,222 |
| 73. | Middletown | 28 | 39,303(0.07%)#73 | 309,357(0.01%)#1,254 |
| 74. | Latham | 28 | 39,303(0.07%)#74 | 309,357(0.01%)#1,263 |
| 75. | Alfred | 28 | 39,303(0.07%)#75 | 309,357(0.01%)#1,267 |
| 76. | Watervliet | 27 | 39,303(0.07%)#76 | 309,357(0.01%)#1,279 |
| 77. | Pleasant Valley | 27 | 39,303(0.07%)#77 | 309,357(0.01%)#1,289 |
| 78. | Farmingdale | 25 | 39,303(0.06%)#78 | 309,357(0.01%)#1,327 |
| 79. | Eggertsville | 23 | 39,303(0.06%)#79 | 309,357(0.01%)#1,364 |
| 80. | North New Hyde Park | 23 | 39,303(0.06%)#80 | 309,357(0.01%)#1,366 |
| 81. | New City | 22 | 39,303(0.06%)#81 | 309,357(0.01%)#1,379 |
| 82. | East Patchogue | 22 | 39,303(0.06%)#82 | 309,357(0.01%)#1,386 |
| 83. | Old Westbury | 22 | 39,303(0.06%)#83 | 309,357(0.01%)#1,393 |
| 84. | Port Ewen | 22 | 39,303(0.06%)#84 | 309,357(0.01%)#1,394 |
| 85. | Northwest Ithaca | 22 | 39,303(0.06%)#85 | 309,357(0.01%)#1,397 |
| 86. | Baldwin | 21 | 39,303(0.05%)#86 | 309,357(0.01%)#1,406 |
| 87. | West Islip | 21 | 39,303(0.05%)#87 | 309,357(0.01%)#1,408 |
| 88. | Atlantic Beach | 21 | 39,303(0.05%)#88 | 309,357(0.01%)#1,420 |
| 89. | Irondequoit | 20 | 39,303(0.05%)#89 | 309,357(0.01%)#1,428 |
| 90. | Inwood | 20 | 39,303(0.05%)#90 | 309,357(0.01%)#1,445 |
| 91. | Conesus Lake | 20 | 39,303(0.05%)#91 | 309,357(0.01%)#1,453 |
| 92. | West Babylon | 19 | 39,303(0.05%)#92 | 309,357(0.01%)#1,462 |
| 93. | Hillcrest | 19 | 39,303(0.05%)#93 | 309,357(0.01%)#1,476 |
| 94. | Locust Valley | 19 | 39,303(0.05%)#94 | 309,357(0.01%)#1,480 |
| 95. | Nanuet | 18 | 39,303(0.05%)#95 | 309,357(0.01%)#1,498 |
| 96. | Pearl River | 18 | 39,303(0.05%)#96 | 309,357(0.01%)#1,501 |
| 97. | Lacona | 18 | 39,303(0.05%)#97 | 309,357(0.01%)#1,515 |
| 98. | South Blooming Grove | 17 | 39,303(0.04%)#98 | 309,357(0.01%)#1,556 |
| 99. | Highland Falls | 17 | 39,303(0.04%)#99 | 309,357(0.01%)#1,557 |
| 100. | Shinnecock Hills | 17 | 39,303(0.04%)#100 | 309,357(0.01%)#1,561 |
Common Questions
What are the Top 10 Cities with the Largest Egyptian Community in New York?
Top 10 Cities with the Largest Egyptian Community in New York are:
#1
29,498
#2
432
#3
329
#4
252
#5
180
#6
179
#7
167
#8
159
#9
158
#10
155
What city has the Largest Egyptian Community in New York?
New York has the Largest Egyptian Community in New York with 29,498.
What is the Total Egyptian Population in the State of New York?
Total Egyptian Population in New York is 39,303.
What is the Total Egyptian Population in the United States?
Total Egyptian Population in the United States is 309,357.