Cities with the Highest Poverty Level Among Single Females in Georgia
RELATED REPORTS & OPTIONS
Highest Poverty | Single Female
Georgia
Compare Cities
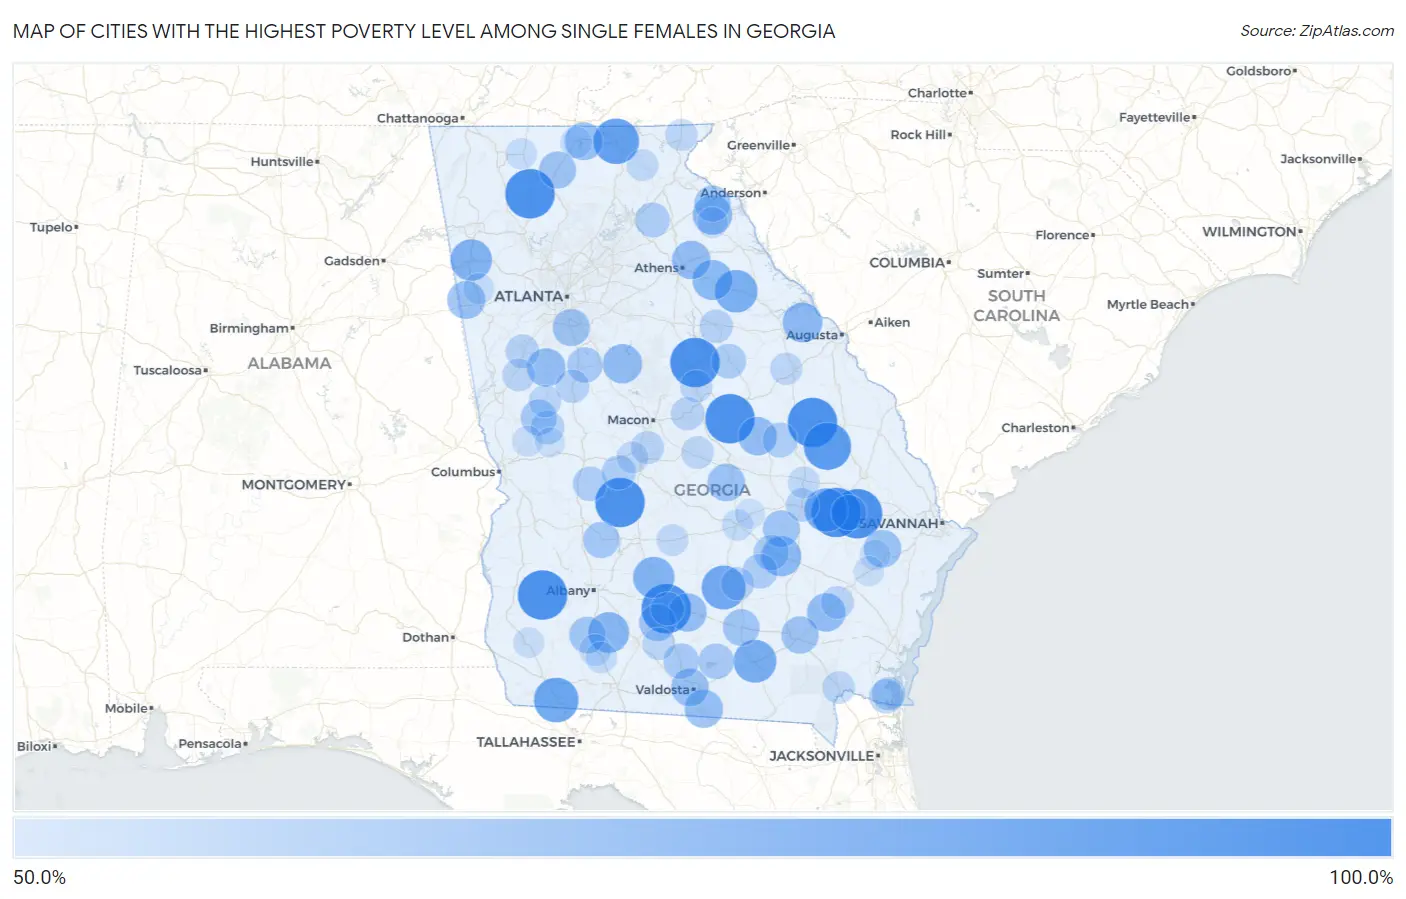
Map of Cities with the Highest Poverty Level Among Single Females in Georgia
0.0%
100.0%
Cities with the Highest Poverty Level Among Single Females in Georgia
| City | Single Female Poverty | vs State | vs National | |
| 1. | Morgan | 100.0% | 25.2%(+74.8)#1 | 24.1%(+75.9)#33 |
| 2. | Milstead | 100.0% | 25.2%(+74.8)#2 | 24.1%(+75.9)#140 |
| 3. | Crooked Creek | 100.0% | 25.2%(+74.8)#3 | 24.1%(+75.9)#176 |
| 4. | Eulonia | 100.0% | 25.2%(+74.8)#4 | 24.1%(+75.9)#217 |
| 5. | Phillipsburg | 100.0% | 25.2%(+74.8)#5 | 24.1%(+75.9)#283 |
| 6. | Midville | 100.0% | 25.2%(+74.8)#6 | 24.1%(+75.9)#309 |
| 7. | Daisy | 100.0% | 25.2%(+74.8)#7 | 24.1%(+75.9)#356 |
| 8. | Oconee | 100.0% | 25.2%(+74.8)#8 | 24.1%(+75.9)#422 |
| 9. | Warthen | 100.0% | 25.2%(+74.8)#9 | 24.1%(+75.9)#654 |
| 10. | Gough | 100.0% | 25.2%(+74.8)#10 | 24.1%(+75.9)#747 |
| 11. | Manassas | 100.0% | 25.2%(+74.8)#11 | 24.1%(+75.9)#823 |
| 12. | Ranger | 100.0% | 25.2%(+74.8)#12 | 24.1%(+75.9)#884 |
| 13. | Dooling | 100.0% | 25.2%(+74.8)#13 | 24.1%(+75.9)#933 |
| 14. | Garfield | 95.0% | 25.2%(+69.8)#14 | 24.1%(+70.9)#979 |
| 15. | Blairsville | 91.1% | 25.2%(+65.9)#15 | 24.1%(+67.0)#1,019 |
| 16. | Attapulgus | 88.9% | 25.2%(+63.7)#16 | 24.1%(+64.8)#1,058 |
| 17. | Ambrose | 87.5% | 25.2%(+62.3)#17 | 24.1%(+63.4)#1,101 |
| 18. | Collins | 86.0% | 25.2%(+60.8)#18 | 24.1%(+62.0)#1,133 |
| 19. | Homerville | 84.9% | 25.2%(+59.7)#19 | 24.1%(+60.8)#1,169 |
| 20. | Rayle | 84.2% | 25.2%(+59.0)#20 | 24.1%(+60.1)#1,187 |
| 21. | Cedartown | 81.6% | 25.2%(+56.4)#21 | 24.1%(+57.5)#1,278 |
| 22. | Sycamore | 81.2% | 25.2%(+56.1)#22 | 24.1%(+57.2)#1,292 |
| 23. | Sale City | 80.0% | 25.2%(+54.8)#23 | 24.1%(+55.9)#1,329 |
| 24. | Graham | 78.6% | 25.2%(+53.4)#24 | 24.1%(+54.5)#1,387 |
| 25. | Lexington | 78.4% | 25.2%(+53.2)#25 | 24.1%(+54.3)#1,397 |
| 26. | Appling | 77.5% | 25.2%(+52.3)#26 | 24.1%(+53.4)#1,447 |
| 27. | Canon | 77.1% | 25.2%(+51.9)#27 | 24.1%(+53.1)#1,460 |
| 28. | Flovilla | 76.3% | 25.2%(+51.1)#28 | 24.1%(+52.2)#1,507 |
| 29. | Wrightsville | 75.0% | 25.2%(+49.8)#29 | 24.1%(+50.9)#1,535 |
| 30. | Offerman | 75.0% | 25.2%(+49.8)#30 | 24.1%(+50.9)#1,540 |
| 31. | Haralson | 75.0% | 25.2%(+49.8)#31 | 24.1%(+50.9)#1,569 |
| 32. | Hull | 75.0% | 25.2%(+49.8)#32 | 24.1%(+50.9)#1,574 |
| 33. | Enigma | 74.7% | 25.2%(+49.5)#33 | 24.1%(+50.6)#1,605 |
| 34. | Lake Park | 74.5% | 25.2%(+49.3)#34 | 24.1%(+50.4)#1,609 |
| 35. | Morganton | 73.7% | 25.2%(+48.5)#35 | 24.1%(+49.6)#1,642 |
| 36. | Tallapoosa | 73.6% | 25.2%(+48.4)#36 | 24.1%(+49.6)#1,645 |
| 37. | Remerton | 73.3% | 25.2%(+48.1)#37 | 24.1%(+49.3)#1,653 |
| 38. | Rentz | 72.7% | 25.2%(+47.5)#38 | 24.1%(+48.7)#1,692 |
| 39. | Fort Stewart | 72.6% | 25.2%(+47.4)#39 | 24.1%(+48.5)#1,699 |
| 40. | Sunnyside | 72.0% | 25.2%(+46.8)#40 | 24.1%(+48.0)#1,724 |
| 41. | East Ellijay | 71.9% | 25.2%(+46.7)#41 | 24.1%(+47.8)#1,733 |
| 42. | Jonesboro | 71.8% | 25.2%(+46.6)#42 | 24.1%(+47.7)#1,735 |
| 43. | Omega | 71.6% | 25.2%(+46.4)#43 | 24.1%(+47.6)#1,740 |
| 44. | Uvalda | 71.1% | 25.2%(+45.9)#44 | 24.1%(+47.0)#1,791 |
| 45. | Pearson | 70.8% | 25.2%(+45.6)#45 | 24.1%(+46.7)#1,806 |
| 46. | Ellerslie | 70.4% | 25.2%(+45.2)#46 | 24.1%(+46.3)#1,833 |
| 47. | Camilla | 70.1% | 25.2%(+44.9)#47 | 24.1%(+46.1)#1,845 |
| 48. | Lavonia | 69.8% | 25.2%(+44.6)#48 | 24.1%(+45.8)#1,878 |
| 49. | Leslie | 69.7% | 25.2%(+44.5)#49 | 24.1%(+45.6)#1,888 |
| 50. | Manchester | 69.2% | 25.2%(+44.0)#50 | 24.1%(+45.2)#1,911 |
| 51. | Cecil | 68.4% | 25.2%(+43.2)#51 | 24.1%(+44.3)#1,996 |
| 52. | Lakeland | 68.4% | 25.2%(+43.2)#52 | 24.1%(+44.3)#2,000 |
| 53. | East Griffin | 68.2% | 25.2%(+43.0)#53 | 24.1%(+44.1)#2,008 |
| 54. | Claxton | 67.7% | 25.2%(+42.5)#54 | 24.1%(+43.6)#2,035 |
| 55. | Hazlehurst | 67.5% | 25.2%(+42.3)#55 | 24.1%(+43.4)#2,047 |
| 56. | Gillsville | 66.7% | 25.2%(+41.5)#56 | 24.1%(+42.6)#2,137 |
| 57. | Denton | 66.7% | 25.2%(+41.5)#57 | 24.1%(+42.6)#2,146 |
| 58. | Kite | 66.7% | 25.2%(+41.5)#58 | 24.1%(+42.6)#2,168 |
| 59. | Sparta | 66.5% | 25.2%(+41.3)#59 | 24.1%(+42.4)#2,227 |
| 60. | Ideal | 66.0% | 25.2%(+40.8)#60 | 24.1%(+41.9)#2,251 |
| 61. | Box Springs | 65.9% | 25.2%(+40.7)#61 | 24.1%(+41.8)#2,255 |
| 62. | Marshallville | 65.8% | 25.2%(+40.6)#62 | 24.1%(+41.7)#2,260 |
| 63. | St Marys | 65.3% | 25.2%(+40.1)#63 | 24.1%(+41.3)#2,288 |
| 64. | Woodland | 64.3% | 25.2%(+39.1)#64 | 24.1%(+40.2)#2,379 |
| 65. | East Newnan | 64.0% | 25.2%(+38.8)#65 | 24.1%(+39.9)#2,399 |
| 66. | Unionville | 63.8% | 25.2%(+38.6)#66 | 24.1%(+39.7)#2,415 |
| 67. | Kings Bay Base | 63.7% | 25.2%(+38.5)#67 | 24.1%(+39.7)#2,421 |
| 68. | Siloam | 63.6% | 25.2%(+38.4)#68 | 24.1%(+39.6)#2,433 |
| 69. | Zebulon | 63.5% | 25.2%(+38.3)#69 | 24.1%(+39.4)#2,447 |
| 70. | Lyons | 63.4% | 25.2%(+38.2)#70 | 24.1%(+39.3)#2,458 |
| 71. | Gordon | 63.1% | 25.2%(+37.9)#71 | 24.1%(+39.0)#2,488 |
| 72. | Centerville | 62.9% | 25.2%(+37.7)#72 | 24.1%(+38.8)#2,497 |
| 73. | Broxton | 62.8% | 25.2%(+37.6)#73 | 24.1%(+38.7)#2,505 |
| 74. | Screven | 62.5% | 25.2%(+37.3)#74 | 24.1%(+38.4)#2,541 |
| 75. | Lone Oak | 62.1% | 25.2%(+36.9)#75 | 24.1%(+38.0)#2,604 |
| 76. | Folkston | 61.9% | 25.2%(+36.7)#76 | 24.1%(+37.8)#2,626 |
| 77. | Ellenton | 61.5% | 25.2%(+36.3)#77 | 24.1%(+37.5)#2,659 |
| 78. | Danville | 61.5% | 25.2%(+36.3)#78 | 24.1%(+37.5)#2,664 |
| 79. | Milledgeville | 61.2% | 25.2%(+36.0)#79 | 24.1%(+37.2)#2,688 |
| 80. | Woodbury | 61.2% | 25.2%(+36.0)#80 | 24.1%(+37.1)#2,695 |
| 81. | Stapleton | 61.1% | 25.2%(+35.9)#81 | 24.1%(+37.0)#2,705 |
| 82. | Mountain City | 60.7% | 25.2%(+35.5)#82 | 24.1%(+36.6)#2,732 |
| 83. | Fort Valley | 60.4% | 25.2%(+35.2)#83 | 24.1%(+36.3)#2,764 |
| 84. | Bemiss | 60.1% | 25.2%(+34.9)#84 | 24.1%(+36.1)#2,779 |
| 85. | Rochelle | 60.0% | 25.2%(+34.8)#85 | 24.1%(+35.9)#2,797 |
| 86. | Oak Park | 60.0% | 25.2%(+34.8)#86 | 24.1%(+35.9)#2,813 |
| 87. | Helen | 60.0% | 25.2%(+34.8)#87 | 24.1%(+35.9)#2,815 |
| 88. | Blue Ridge | 59.7% | 25.2%(+34.5)#88 | 24.1%(+35.6)#2,896 |
| 89. | Pelham | 59.6% | 25.2%(+34.4)#89 | 24.1%(+35.5)#2,908 |
| 90. | Meigs | 59.4% | 25.2%(+34.2)#90 | 24.1%(+35.3)#2,919 |
| 91. | Mcrae Helena | 59.1% | 25.2%(+33.9)#91 | 24.1%(+35.0)#2,954 |
| 92. | Buchanan | 59.0% | 25.2%(+33.8)#92 | 24.1%(+34.9)#2,979 |
| 93. | Chatsworth | 58.7% | 25.2%(+33.5)#93 | 24.1%(+34.6)#3,019 |
| 94. | Waverly Hall | 58.2% | 25.2%(+33.0)#94 | 24.1%(+34.1)#3,069 |
| 95. | Royston | 57.9% | 25.2%(+32.7)#95 | 24.1%(+33.8)#3,090 |
| 96. | Gumbranch | 57.9% | 25.2%(+32.7)#96 | 24.1%(+33.8)#3,094 |
| 97. | Colquitt | 57.6% | 25.2%(+32.4)#97 | 24.1%(+33.5)#3,113 |
| 98. | Ludowici | 57.0% | 25.2%(+31.8)#98 | 24.1%(+33.0)#3,226 |
| 99. | Talbotton | 56.5% | 25.2%(+31.3)#99 | 24.1%(+32.4)#3,289 |
| 100. | Alamo | 56.5% | 25.2%(+31.3)#100 | 24.1%(+32.4)#3,292 |
Common Questions
What are the Top 10 Cities with the Highest Poverty Level Among Single Females in Georgia?
Top 10 Cities with the Highest Poverty Level Among Single Females in Georgia are:
#1
100.0%
#2
100.0%
#3
100.0%
#4
100.0%
#5
100.0%
#6
100.0%
#7
100.0%
#8
100.0%
#9
100.0%
#10
95.0%
What city has the Highest Poverty Level Among Single Females in Georgia?
Morgan has the Highest Poverty Level Among Single Females in Georgia with 100.0%.
What is the Poverty Level Among Single Females in the State of Georgia?
Poverty Level Among Single Females in Georgia is 25.2%.
What is the Poverty Level Among Single Females in the United States?
Poverty Level Among Single Females in the United States is 24.1%.