Cities with the Highest Poverty Level Among Single Females in Ohio
RELATED REPORTS & OPTIONS
Highest Poverty | Single Female
Ohio
Compare Cities
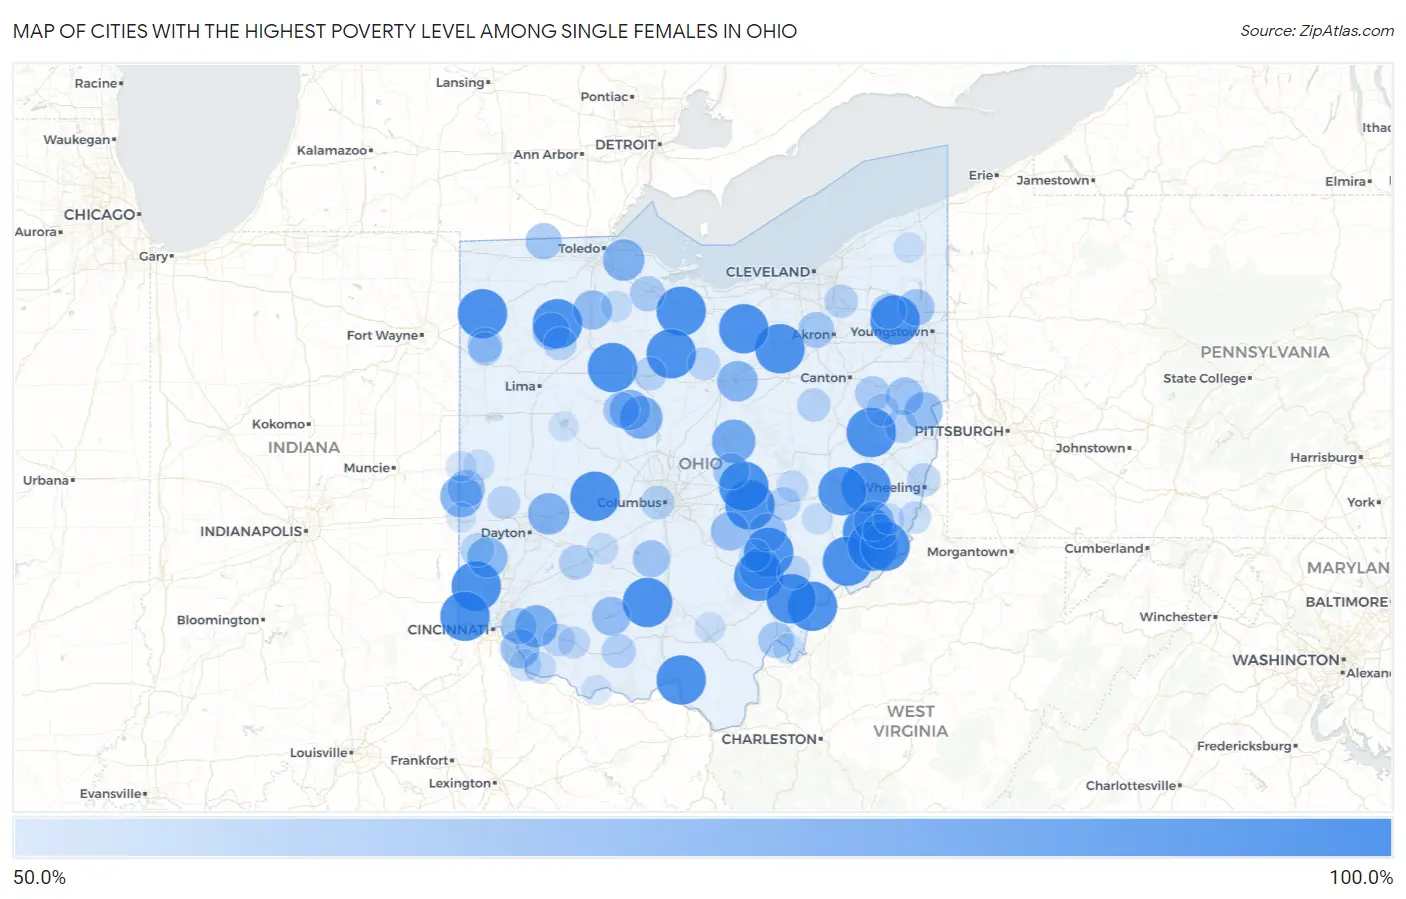
Map of Cities with the Highest Poverty Level Among Single Females in Ohio
0.0%
100.0%
Cities with the Highest Poverty Level Among Single Females in Ohio
| City | Single Female Poverty | vs State | vs National | |
| 1. | South Canal | 100.0% | 28.5%(+71.5)#1 | 24.1%(+75.9)#94 |
| 2. | Sciotodale | 100.0% | 28.5%(+71.5)#2 | 24.1%(+75.9)#139 |
| 3. | Little Hocking | 100.0% | 28.5%(+71.5)#3 | 24.1%(+75.9)#191 |
| 4. | Millville | 100.0% | 28.5%(+71.5)#4 | 24.1%(+75.9)#199 |
| 5. | Hooven | 100.0% | 28.5%(+71.5)#5 | 24.1%(+75.9)#209 |
| 6. | Miller | 100.0% | 28.5%(+71.5)#6 | 24.1%(+75.9)#239 |
| 7. | Madison Place | 100.0% | 28.5%(+71.5)#7 | 24.1%(+75.9)#243 |
| 8. | Bowerston | 100.0% | 28.5%(+71.5)#8 | 24.1%(+75.9)#279 |
| 9. | Buchtel | 100.0% | 28.5%(+71.5)#9 | 24.1%(+75.9)#318 |
| 10. | Bourneville | 100.0% | 28.5%(+71.5)#10 | 24.1%(+75.9)#332 |
| 11. | Wharton | 100.0% | 28.5%(+71.5)#11 | 24.1%(+75.9)#347 |
| 12. | Brownsville | 100.0% | 28.5%(+71.5)#12 | 24.1%(+75.9)#349 |
| 13. | Marne | 100.0% | 28.5%(+71.5)#13 | 24.1%(+75.9)#366 |
| 14. | Petersburg | 100.0% | 28.5%(+71.5)#14 | 24.1%(+75.9)#380 |
| 15. | Stewart | 100.0% | 28.5%(+71.5)#15 | 24.1%(+75.9)#397 |
| 16. | Burbank | 100.0% | 28.5%(+71.5)#16 | 24.1%(+75.9)#408 |
| 17. | Flat Rock | 100.0% | 28.5%(+71.5)#17 | 24.1%(+75.9)#431 |
| 18. | Catawba | 100.0% | 28.5%(+71.5)#18 | 24.1%(+75.9)#478 |
| 19. | Chatfield | 100.0% | 28.5%(+71.5)#19 | 24.1%(+75.9)#500 |
| 20. | Lewisville | 100.0% | 28.5%(+71.5)#20 | 24.1%(+75.9)#628 |
| 21. | Rochester | 100.0% | 28.5%(+71.5)#21 | 24.1%(+75.9)#662 |
| 22. | Cecil | 100.0% | 28.5%(+71.5)#22 | 24.1%(+75.9)#701 |
| 23. | Lower Salem | 100.0% | 28.5%(+71.5)#23 | 24.1%(+75.9)#744 |
| 24. | Belmore | 100.0% | 28.5%(+71.5)#24 | 24.1%(+75.9)#794 |
| 25. | Graysville | 100.0% | 28.5%(+71.5)#25 | 24.1%(+75.9)#836 |
| 26. | Rendville | 100.0% | 28.5%(+71.5)#26 | 24.1%(+75.9)#893 |
| 27. | Antioch | 100.0% | 28.5%(+71.5)#27 | 24.1%(+75.9)#916 |
| 28. | Fairview | 100.0% | 28.5%(+71.5)#28 | 24.1%(+75.9)#926 |
| 29. | Old Washington | 97.7% | 28.5%(+69.1)#29 | 24.1%(+73.6)#971 |
| 30. | Gambier | 87.5% | 28.5%(+59.0)#30 | 24.1%(+63.4)#1,088 |
| 31. | Green Camp | 85.7% | 28.5%(+57.2)#31 | 24.1%(+61.6)#1,142 |
| 32. | Owensville | 84.7% | 28.5%(+56.2)#32 | 24.1%(+60.6)#1,174 |
| 33. | Hollansburg | 84.2% | 28.5%(+55.7)#33 | 24.1%(+60.1)#1,186 |
| 34. | New Haven Cdp Huron County | 83.6% | 28.5%(+55.1)#34 | 24.1%(+59.6)#1,196 |
| 35. | Murray City | 83.3% | 28.5%(+54.8)#35 | 24.1%(+59.3)#1,214 |
| 36. | Clay Center | 83.3% | 28.5%(+54.8)#36 | 24.1%(+59.3)#1,215 |
| 37. | Crystal Lakes | 83.2% | 28.5%(+54.6)#37 | 24.1%(+59.1)#1,235 |
| 38. | Mifflin | 81.5% | 28.5%(+52.9)#38 | 24.1%(+57.4)#1,285 |
| 39. | New Bloomington | 81.2% | 28.5%(+52.7)#39 | 24.1%(+57.2)#1,295 |
| 40. | West Elkton | 81.0% | 28.5%(+52.4)#40 | 24.1%(+56.9)#1,304 |
| 41. | Miltonsburg | 80.0% | 28.5%(+51.5)#41 | 24.1%(+55.9)#1,357 |
| 42. | Guilford Lake | 78.9% | 28.5%(+50.3)#42 | 24.1%(+54.8)#1,378 |
| 43. | Cygnet | 78.3% | 28.5%(+49.7)#43 | 24.1%(+54.2)#1,400 |
| 44. | New Richmond | 77.8% | 28.5%(+49.2)#44 | 24.1%(+53.7)#1,414 |
| 45. | Highland Holiday | 77.4% | 28.5%(+48.9)#45 | 24.1%(+53.3)#1,448 |
| 46. | Rushville | 76.9% | 28.5%(+48.4)#46 | 24.1%(+52.8)#1,475 |
| 47. | South Mount Vernon | 76.6% | 28.5%(+48.1)#47 | 24.1%(+52.6)#1,485 |
| 48. | Crooksville | 76.6% | 28.5%(+48.0)#48 | 24.1%(+52.5)#1,488 |
| 49. | Irondale | 76.5% | 28.5%(+47.9)#49 | 24.1%(+52.4)#1,500 |
| 50. | West Leipsic | 75.0% | 28.5%(+46.5)#50 | 24.1%(+50.9)#1,567 |
| 51. | Summitville | 75.0% | 28.5%(+46.5)#51 | 24.1%(+50.9)#1,571 |
| 52. | Palestine | 75.0% | 28.5%(+46.5)#52 | 24.1%(+50.9)#1,573 |
| 53. | Williamsport | 73.8% | 28.5%(+45.3)#53 | 24.1%(+49.8)#1,629 |
| 54. | Morgandale | 73.3% | 28.5%(+44.8)#54 | 24.1%(+49.3)#1,654 |
| 55. | St Louisville | 72.7% | 28.5%(+44.2)#55 | 24.1%(+48.7)#1,687 |
| 56. | Lyons | 72.4% | 28.5%(+43.9)#56 | 24.1%(+48.3)#1,706 |
| 57. | La Rue | 72.0% | 28.5%(+43.5)#57 | 24.1%(+47.9)#1,725 |
| 58. | Summerside | 71.9% | 28.5%(+43.4)#58 | 24.1%(+47.9)#1,730 |
| 59. | Pomeroy | 71.9% | 28.5%(+43.4)#59 | 24.1%(+47.9)#1,731 |
| 60. | Pigeon Creek | 71.9% | 28.5%(+43.3)#60 | 24.1%(+47.8)#1,732 |
| 61. | Windham | 71.2% | 28.5%(+42.7)#61 | 24.1%(+47.1)#1,782 |
| 62. | Stony Prairie | 70.4% | 28.5%(+41.9)#62 | 24.1%(+46.3)#1,831 |
| 63. | Haviland | 70.0% | 28.5%(+41.5)#63 | 24.1%(+45.9)#1,861 |
| 64. | Malvern | 69.9% | 28.5%(+41.4)#64 | 24.1%(+45.8)#1,875 |
| 65. | Port William | 69.0% | 28.5%(+40.4)#65 | 24.1%(+44.9)#1,939 |
| 66. | Woodsfield | 68.9% | 28.5%(+40.4)#66 | 24.1%(+44.8)#1,945 |
| 67. | Peebles | 67.9% | 28.5%(+39.4)#67 | 24.1%(+43.8)#2,025 |
| 68. | Camden | 67.6% | 28.5%(+39.1)#68 | 24.1%(+43.6)#2,039 |
| 69. | Valleyview | 67.4% | 28.5%(+38.9)#69 | 24.1%(+43.3)#2,053 |
| 70. | Martins Ferry | 67.0% | 28.5%(+38.5)#70 | 24.1%(+42.9)#2,071 |
| 71. | Pleasant Grove | 66.7% | 28.5%(+38.1)#71 | 24.1%(+42.6)#2,084 |
| 72. | Twinsburg Heights | 66.7% | 28.5%(+38.1)#72 | 24.1%(+42.6)#2,086 |
| 73. | Nevada | 66.7% | 28.5%(+38.1)#73 | 24.1%(+42.6)#2,095 |
| 74. | Amsterdam | 66.7% | 28.5%(+38.1)#74 | 24.1%(+42.6)#2,115 |
| 75. | Chesterhill | 66.7% | 28.5%(+38.1)#75 | 24.1%(+42.6)#2,130 |
| 76. | Winesburg | 66.7% | 28.5%(+38.1)#76 | 24.1%(+42.6)#2,154 |
| 77. | Gilboa | 66.7% | 28.5%(+38.1)#77 | 24.1%(+42.6)#2,157 |
| 78. | Scott | 66.7% | 28.5%(+38.1)#78 | 24.1%(+42.6)#2,161 |
| 79. | Potsdam | 65.6% | 28.5%(+37.1)#79 | 24.1%(+41.5)#2,269 |
| 80. | Carrollton | 65.4% | 28.5%(+36.9)#80 | 24.1%(+41.3)#2,283 |
| 81. | Mount Orab | 65.2% | 28.5%(+36.7)#81 | 24.1%(+41.2)#2,295 |
| 82. | Shelby | 65.2% | 28.5%(+36.7)#82 | 24.1%(+41.1)#2,296 |
| 83. | Powhatan Point | 64.4% | 28.5%(+35.9)#83 | 24.1%(+40.4)#2,360 |
| 84. | Sardinia | 64.3% | 28.5%(+35.7)#84 | 24.1%(+40.2)#2,368 |
| 85. | Moscow | 64.3% | 28.5%(+35.7)#85 | 24.1%(+40.2)#2,385 |
| 86. | Felicity | 63.6% | 28.5%(+35.1)#86 | 24.1%(+39.6)#2,428 |
| 87. | Shawnee | 63.6% | 28.5%(+35.1)#87 | 24.1%(+39.6)#2,431 |
| 88. | Adamsville | 63.6% | 28.5%(+35.1)#88 | 24.1%(+39.6)#2,434 |
| 89. | Jeffersonville | 63.3% | 28.5%(+34.8)#89 | 24.1%(+39.2)#2,464 |
| 90. | Risingsun | 62.5% | 28.5%(+34.0)#90 | 24.1%(+38.4)#2,549 |
| 91. | Beallsville | 62.5% | 28.5%(+34.0)#91 | 24.1%(+38.4)#2,552 |
| 92. | Cumberland | 62.5% | 28.5%(+34.0)#92 | 24.1%(+38.4)#2,558 |
| 93. | Ansonia | 62.1% | 28.5%(+33.6)#93 | 24.1%(+38.0)#2,595 |
| 94. | Racine | 61.8% | 28.5%(+33.3)#94 | 24.1%(+37.8)#2,627 |
| 95. | Rock Creek | 61.5% | 28.5%(+33.0)#95 | 24.1%(+37.5)#2,652 |
| 96. | Coalton | 61.5% | 28.5%(+33.0)#96 | 24.1%(+37.5)#2,657 |
| 97. | Union City | 61.3% | 28.5%(+32.7)#97 | 24.1%(+37.2)#2,687 |
| 98. | Manchester | 60.6% | 28.5%(+32.1)#98 | 24.1%(+36.6)#2,741 |
| 99. | Russells Point | 60.3% | 28.5%(+31.7)#99 | 24.1%(+36.2)#2,775 |
| 100. | New Paris | 60.0% | 28.5%(+31.5)#100 | 24.1%(+35.9)#2,792 |
Common Questions
What are the Top 10 Cities with the Highest Poverty Level Among Single Females in Ohio?
Top 10 Cities with the Highest Poverty Level Among Single Females in Ohio are:
#1
100.0%
#2
100.0%
#3
100.0%
#4
100.0%
#5
100.0%
#6
100.0%
#7
100.0%
#8
100.0%
#9
100.0%
#10
100.0%
What city has the Highest Poverty Level Among Single Females in Ohio?
South Canal has the Highest Poverty Level Among Single Females in Ohio with 100.0%.
What is the Poverty Level Among Single Females in the State of Ohio?
Poverty Level Among Single Females in Ohio is 28.5%.
What is the Poverty Level Among Single Females in the United States?
Poverty Level Among Single Females in the United States is 24.1%.