Cities with the Highest Poverty Level Among Single Females in Michigan
RELATED REPORTS & OPTIONS
Highest Poverty | Single Female
Michigan
Compare Cities
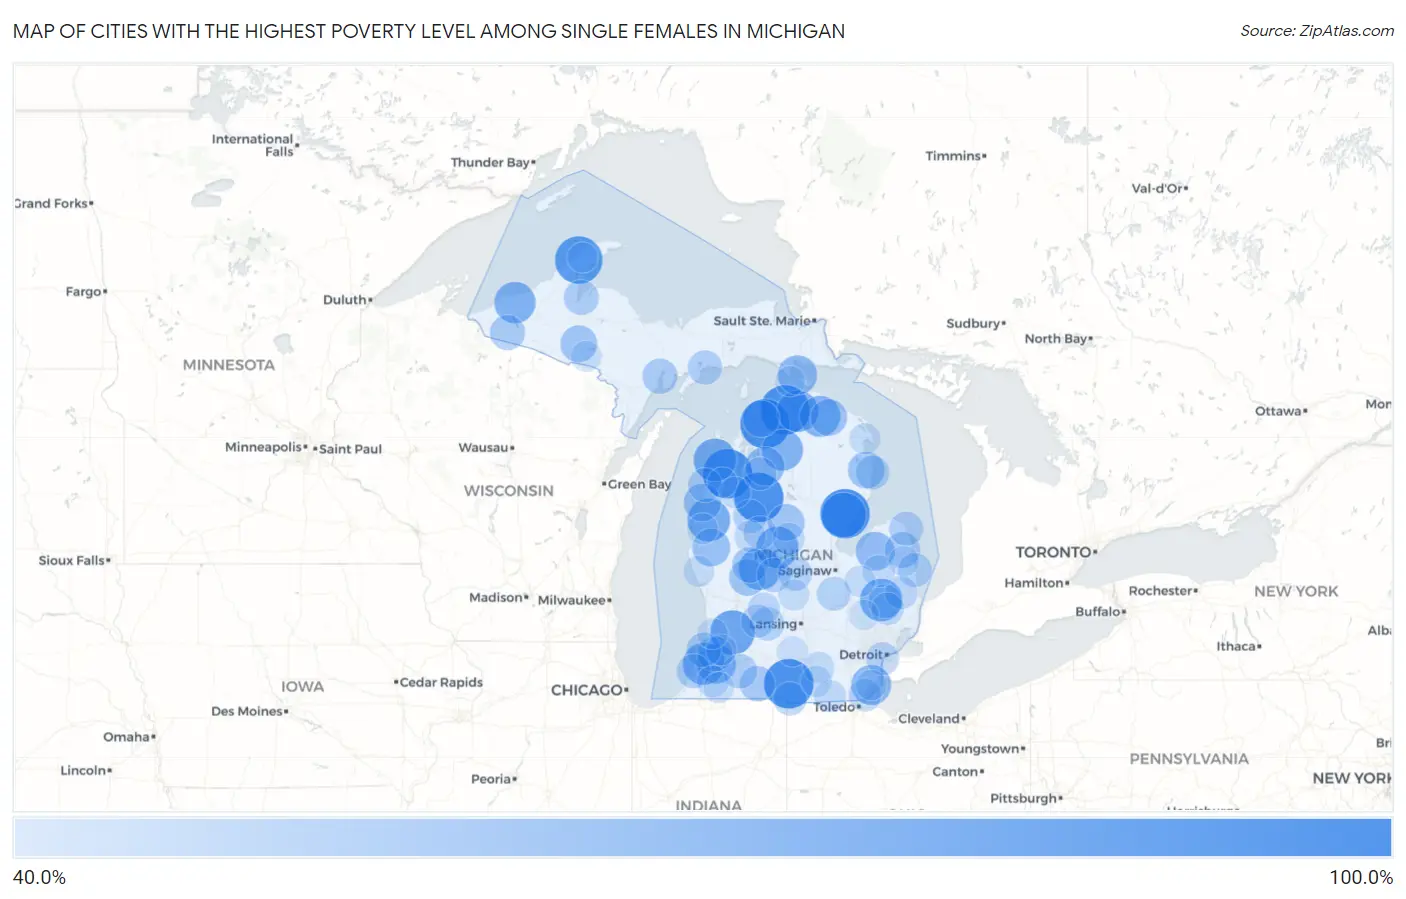
Map of Cities with the Highest Poverty Level Among Single Females in Michigan
0.0%
100.0%
Cities with the Highest Poverty Level Among Single Females in Michigan
| City | Single Female Poverty | vs State | vs National | |
| 1. | Millburg | 100.0% | 25.4%(+74.6)#1 | 24.1%(+75.9)#268 |
| 2. | Dodgeville | 100.0% | 25.4%(+74.6)#2 | 24.1%(+75.9)#284 |
| 3. | Shaftsburg | 100.0% | 25.4%(+74.6)#3 | 24.1%(+75.9)#315 |
| 4. | Palo | 100.0% | 25.4%(+74.6)#4 | 24.1%(+75.9)#321 |
| 5. | Brimley | 100.0% | 25.4%(+74.6)#5 | 24.1%(+75.9)#345 |
| 6. | Oden | 100.0% | 25.4%(+74.6)#6 | 24.1%(+75.9)#403 |
| 7. | Bendon | 100.0% | 25.4%(+74.6)#7 | 24.1%(+75.9)#426 |
| 8. | Falmouth | 100.0% | 25.4%(+74.6)#8 | 24.1%(+75.9)#485 |
| 9. | Hurontown | 100.0% | 25.4%(+74.6)#9 | 24.1%(+75.9)#494 |
| 10. | Mohawk | 100.0% | 25.4%(+74.6)#10 | 24.1%(+75.9)#519 |
| 11. | Allen | 100.0% | 25.4%(+74.6)#11 | 24.1%(+75.9)#550 |
| 12. | Jennings | 100.0% | 25.4%(+74.6)#12 | 24.1%(+75.9)#570 |
| 13. | Ironton | 100.0% | 25.4%(+74.6)#13 | 24.1%(+75.9)#632 |
| 14. | Turner | 100.0% | 25.4%(+74.6)#14 | 24.1%(+75.9)#843 |
| 15. | Calumet | 94.4% | 25.4%(+69.1)#15 | 24.1%(+70.4)#983 |
| 16. | Paris | 88.9% | 25.4%(+63.5)#16 | 24.1%(+64.8)#1,067 |
| 17. | Twining | 87.5% | 25.4%(+62.1)#17 | 24.1%(+63.4)#1,100 |
| 18. | Hopkins | 86.7% | 25.4%(+61.3)#18 | 24.1%(+62.6)#1,112 |
| 19. | Elm Hall | 85.7% | 25.4%(+60.3)#19 | 24.1%(+61.6)#1,152 |
| 20. | Empire | 82.4% | 25.4%(+57.0)#20 | 24.1%(+58.3)#1,249 |
| 21. | Fountain | 82.4% | 25.4%(+57.0)#21 | 24.1%(+58.3)#1,252 |
| 22. | Attica | 81.6% | 25.4%(+56.2)#22 | 24.1%(+57.5)#1,280 |
| 23. | Lakeview | 81.0% | 25.4%(+55.6)#23 | 24.1%(+56.9)#1,303 |
| 24. | Paw Paw Lake | 80.2% | 25.4%(+54.9)#24 | 24.1%(+56.2)#1,313 |
| 25. | Weidman | 80.0% | 25.4%(+54.6)#25 | 24.1%(+55.9)#1,318 |
| 26. | Indian River | 79.0% | 25.4%(+53.6)#26 | 24.1%(+55.0)#1,373 |
| 27. | White Pine | 78.6% | 25.4%(+53.2)#27 | 24.1%(+54.5)#1,390 |
| 28. | Lakes Of The North | 78.0% | 25.4%(+52.6)#28 | 24.1%(+53.9)#1,408 |
| 29. | Onaway | 77.1% | 25.4%(+51.8)#29 | 24.1%(+53.1)#1,461 |
| 30. | Detroit Beach | 74.9% | 25.4%(+49.5)#30 | 24.1%(+50.8)#1,597 |
| 31. | Lake Leann | 74.4% | 25.4%(+49.0)#31 | 24.1%(+50.3)#1,610 |
| 32. | Lawrence | 73.8% | 25.4%(+48.4)#32 | 24.1%(+49.7)#1,633 |
| 33. | Mackinac Island | 73.3% | 25.4%(+48.0)#33 | 24.1%(+49.3)#1,655 |
| 34. | Kalkaska | 72.2% | 25.4%(+46.8)#34 | 24.1%(+48.1)#1,715 |
| 35. | Gagetown | 71.4% | 25.4%(+46.0)#35 | 24.1%(+47.4)#1,759 |
| 36. | Walkerville | 69.2% | 25.4%(+43.8)#36 | 24.1%(+45.2)#1,925 |
| 37. | Parkdale | 69.0% | 25.4%(+43.7)#37 | 24.1%(+45.0)#1,937 |
| 38. | Barnes Lake | 69.0% | 25.4%(+43.6)#38 | 24.1%(+44.9)#1,938 |
| 39. | Atlantic Mine | 68.4% | 25.4%(+43.0)#39 | 24.1%(+44.3)#1,992 |
| 40. | Charlevoix | 66.7% | 25.4%(+41.3)#40 | 24.1%(+42.6)#2,080 |
| 41. | Harrison | 66.7% | 25.4%(+41.3)#41 | 24.1%(+42.6)#2,081 |
| 42. | Amasa | 66.7% | 25.4%(+41.3)#42 | 24.1%(+42.6)#2,145 |
| 43. | Lincoln | 66.7% | 25.4%(+41.3)#43 | 24.1%(+42.6)#2,156 |
| 44. | Millersburg | 66.7% | 25.4%(+41.3)#44 | 24.1%(+42.6)#2,183 |
| 45. | Pierson | 66.7% | 25.4%(+41.3)#45 | 24.1%(+42.6)#2,194 |
| 46. | Morley | 63.9% | 25.4%(+38.5)#46 | 24.1%(+39.8)#2,410 |
| 47. | Minden City | 63.6% | 25.4%(+38.3)#47 | 24.1%(+39.6)#2,439 |
| 48. | Colon | 63.0% | 25.4%(+37.7)#48 | 24.1%(+39.0)#2,489 |
| 49. | Breedsville | 62.5% | 25.4%(+37.1)#49 | 24.1%(+38.4)#2,560 |
| 50. | Marenisco | 62.5% | 25.4%(+37.1)#50 | 24.1%(+38.4)#2,564 |
| 51. | Gladstone | 62.4% | 25.4%(+37.0)#51 | 24.1%(+38.3)#2,581 |
| 52. | Zeba | 62.1% | 25.4%(+36.7)#52 | 24.1%(+38.0)#2,601 |
| 53. | Kincheloe | 61.6% | 25.4%(+36.2)#53 | 24.1%(+37.5)#2,644 |
| 54. | South Haven | 61.3% | 25.4%(+35.9)#54 | 24.1%(+37.2)#2,677 |
| 55. | Schoolcraft | 60.6% | 25.4%(+35.2)#55 | 24.1%(+36.5)#2,744 |
| 56. | Manistique | 60.3% | 25.4%(+34.9)#56 | 24.1%(+36.2)#2,773 |
| 57. | Benton Harbor | 60.0% | 25.4%(+34.7)#57 | 24.1%(+36.0)#2,784 |
| 58. | Port Hope | 60.0% | 25.4%(+34.6)#58 | 24.1%(+35.9)#2,839 |
| 59. | Mcbride | 60.0% | 25.4%(+34.6)#59 | 24.1%(+35.9)#2,854 |
| 60. | Arcadia | 60.0% | 25.4%(+34.6)#60 | 24.1%(+35.9)#2,866 |
| 61. | Port Sanilac | 59.6% | 25.4%(+34.2)#61 | 24.1%(+35.5)#2,906 |
| 62. | New Lothrop | 59.3% | 25.4%(+33.9)#62 | 24.1%(+35.2)#2,940 |
| 63. | Harrisville | 59.3% | 25.4%(+33.9)#63 | 24.1%(+35.2)#2,942 |
| 64. | Imlay City | 59.2% | 25.4%(+33.8)#64 | 24.1%(+35.1)#2,946 |
| 65. | Alma | 58.9% | 25.4%(+33.6)#65 | 24.1%(+34.9)#2,980 |
| 66. | Woodland | 58.8% | 25.4%(+33.4)#66 | 24.1%(+34.7)#3,001 |
| 67. | Tustin | 58.3% | 25.4%(+33.0)#67 | 24.1%(+34.3)#3,062 |
| 68. | Camden | 58.2% | 25.4%(+32.8)#68 | 24.1%(+34.1)#3,070 |
| 69. | Freeport | 57.4% | 25.4%(+32.1)#69 | 24.1%(+33.4)#3,126 |
| 70. | River Rouge | 57.1% | 25.4%(+31.7)#70 | 24.1%(+33.0)#3,223 |
| 71. | Evart | 56.9% | 25.4%(+31.5)#71 | 24.1%(+32.8)#3,239 |
| 72. | Yale | 56.8% | 25.4%(+31.4)#72 | 24.1%(+32.7)#3,252 |
| 73. | Luna Pier | 56.6% | 25.4%(+31.2)#73 | 24.1%(+32.5)#3,271 |
| 74. | South Boardman | 56.5% | 25.4%(+31.1)#74 | 24.1%(+32.4)#3,282 |
| 75. | Almont | 56.1% | 25.4%(+30.7)#75 | 24.1%(+32.0)#3,342 |
| 76. | Saranac | 55.1% | 25.4%(+29.7)#76 | 24.1%(+31.0)#3,473 |
| 77. | Kingston | 54.5% | 25.4%(+29.2)#77 | 24.1%(+30.5)#3,543 |
| 78. | Clare | 54.5% | 25.4%(+29.1)#78 | 24.1%(+30.4)#3,559 |
| 79. | Jasper | 54.2% | 25.4%(+28.8)#79 | 24.1%(+30.1)#3,595 |
| 80. | Napoleon | 53.7% | 25.4%(+28.3)#80 | 24.1%(+29.6)#3,664 |
| 81. | Hersey | 53.3% | 25.4%(+28.0)#81 | 24.1%(+29.3)#3,722 |
| 82. | Dowagiac | 53.1% | 25.4%(+27.7)#82 | 24.1%(+29.0)#3,760 |
| 83. | Mesick | 52.9% | 25.4%(+27.6)#83 | 24.1%(+28.9)#3,784 |
| 84. | Manitou Beach Devils Lake | 52.9% | 25.4%(+27.5)#84 | 24.1%(+28.8)#3,795 |
| 85. | Alpena | 52.8% | 25.4%(+27.4)#85 | 24.1%(+28.7)#3,806 |
| 86. | Whitehall | 52.6% | 25.4%(+27.2)#86 | 24.1%(+28.5)#3,838 |
| 87. | Maple Rapids | 52.3% | 25.4%(+26.9)#87 | 24.1%(+28.2)#3,878 |
| 88. | Millington | 52.2% | 25.4%(+26.9)#88 | 24.1%(+28.2)#3,880 |
| 89. | Scottville | 51.9% | 25.4%(+26.5)#89 | 24.1%(+27.8)#3,933 |
| 90. | Crystal Falls | 51.8% | 25.4%(+26.4)#90 | 24.1%(+27.7)#3,946 |
| 91. | Cassopolis | 51.8% | 25.4%(+26.4)#91 | 24.1%(+27.7)#3,947 |
| 92. | Bloomingdale | 51.5% | 25.4%(+26.1)#92 | 24.1%(+27.4)#3,983 |
| 93. | Fennville | 51.3% | 25.4%(+25.9)#93 | 24.1%(+27.2)#4,012 |
| 94. | Springport | 50.9% | 25.4%(+25.6)#94 | 24.1%(+26.9)#4,048 |
| 95. | Deckerville | 50.7% | 25.4%(+25.3)#95 | 24.1%(+26.6)#4,072 |
| 96. | Ortonville | 50.6% | 25.4%(+25.3)#96 | 24.1%(+26.6)#4,079 |
| 97. | Woodland Beach | 50.5% | 25.4%(+25.1)#97 | 24.1%(+26.4)#4,089 |
| 98. | Mackinaw City | 50.0% | 25.4%(+24.6)#98 | 24.1%(+25.9)#4,193 |
| 99. | Thompsonville | 50.0% | 25.4%(+24.6)#99 | 24.1%(+25.9)#4,241 |
| 100. | Copper City | 50.0% | 25.4%(+24.6)#100 | 24.1%(+25.9)#4,337 |
Common Questions
What are the Top 10 Cities with the Highest Poverty Level Among Single Females in Michigan?
Top 10 Cities with the Highest Poverty Level Among Single Females in Michigan are:
What city has the Highest Poverty Level Among Single Females in Michigan?
Oden has the Highest Poverty Level Among Single Females in Michigan with 100.0%.
What is the Poverty Level Among Single Females in the State of Michigan?
Poverty Level Among Single Females in Michigan is 25.4%.
What is the Poverty Level Among Single Females in the United States?
Poverty Level Among Single Females in the United States is 24.1%.