Cities with the Highest Poverty Level Among Single Females in Maryland
RELATED REPORTS & OPTIONS
Highest Poverty | Single Female
Maryland
Compare Cities
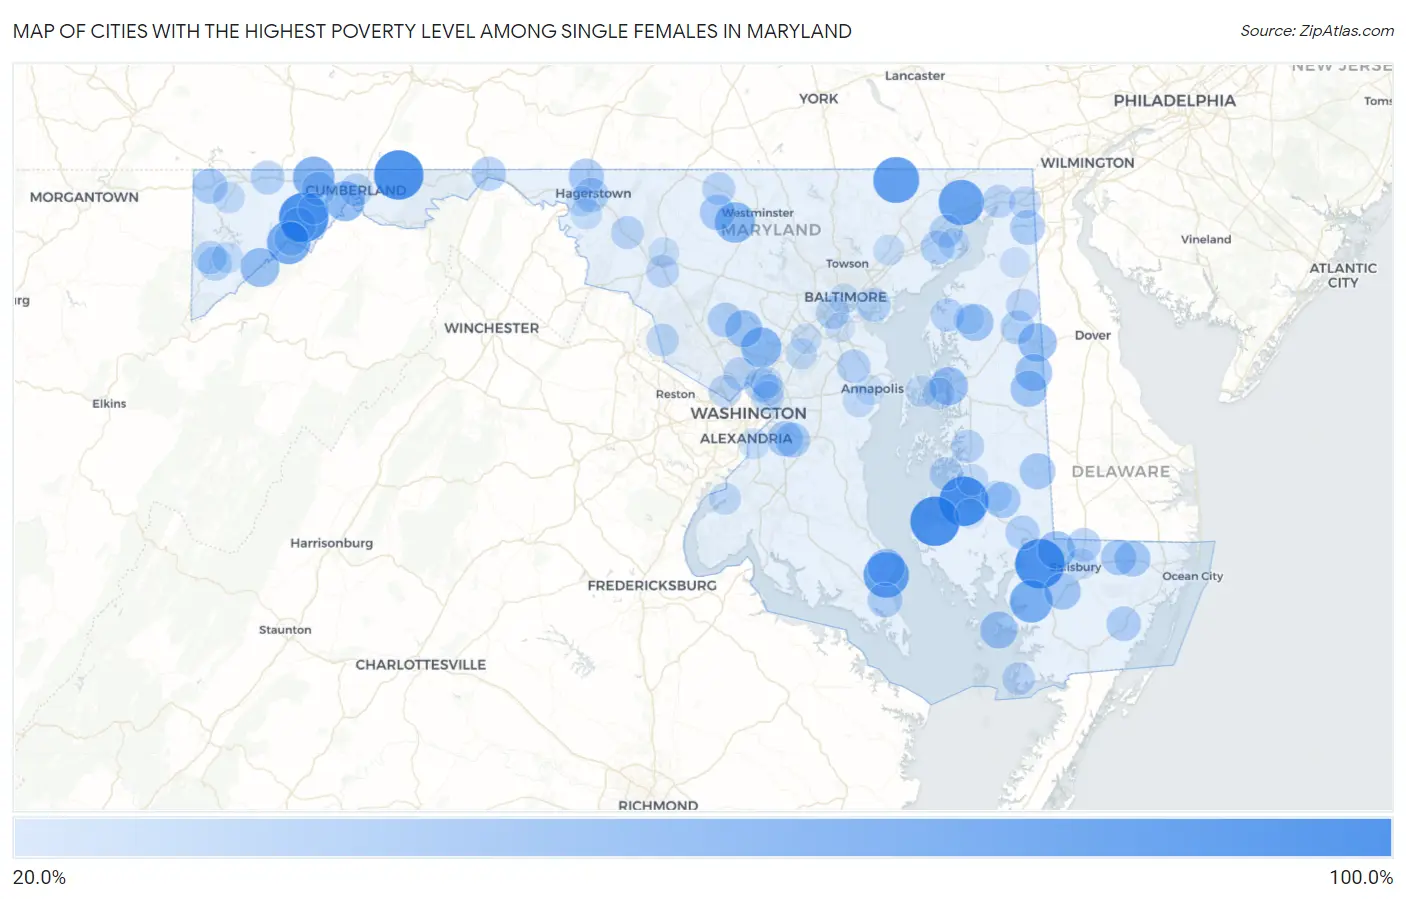
Map of Cities with the Highest Poverty Level Among Single Females in Maryland
0.0%
100.0%
Cities with the Highest Poverty Level Among Single Females in Maryland
| City | Single Female Poverty | vs State | vs National | |
| 1. | Algonquin | 100.0% | 16.4%(+83.6)#1 | 24.1%(+75.9)#86 |
| 2. | Madison | 100.0% | 16.4%(+83.6)#2 | 24.1%(+75.9)#551 |
| 3. | Flintstone | 100.0% | 16.4%(+83.6)#3 | 24.1%(+75.9)#605 |
| 4. | Quantico | 100.0% | 16.4%(+83.6)#4 | 24.1%(+75.9)#627 |
| 5. | Detmold | 100.0% | 16.4%(+83.6)#5 | 24.1%(+75.9)#783 |
| 6. | Pylesville | 85.7% | 16.4%(+69.3)#6 | 24.1%(+61.6)#1,135 |
| 7. | Drum Point | 83.3% | 16.4%(+66.9)#7 | 24.1%(+59.3)#1,200 |
| 8. | Port Deposit | 82.5% | 16.4%(+66.1)#8 | 24.1%(+58.4)#1,246 |
| 9. | Luke | 75.0% | 16.4%(+58.6)#9 | 24.1%(+50.9)#1,593 |
| 10. | Mount Vernon | 72.3% | 16.4%(+56.0)#10 | 24.1%(+48.3)#1,711 |
| 11. | Finzel | 68.4% | 16.4%(+52.0)#11 | 24.1%(+44.3)#1,990 |
| 12. | New Windsor | 62.9% | 16.4%(+46.5)#12 | 24.1%(+38.8)#2,500 |
| 13. | Spencerville | 62.7% | 16.4%(+46.3)#13 | 24.1%(+38.6)#2,519 |
| 14. | Potomac Park | 60.9% | 16.4%(+44.5)#14 | 24.1%(+36.8)#2,718 |
| 15. | Kitzmiller | 57.1% | 16.4%(+40.8)#15 | 24.1%(+33.1)#3,203 |
| 16. | Templeville | 55.6% | 16.4%(+39.2)#16 | 24.1%(+31.5)#3,417 |
| 17. | Queenstown | 53.8% | 16.4%(+37.5)#17 | 24.1%(+29.8)#3,641 |
| 18. | Hebron | 52.4% | 16.4%(+36.0)#18 | 24.1%(+28.3)#3,850 |
| 19. | Ten Mile Creek | 51.4% | 16.4%(+35.0)#19 | 24.1%(+27.4)#3,992 |
| 20. | Lusby | 50.7% | 16.4%(+34.3)#20 | 24.1%(+26.6)#4,070 |
| 21. | Deal Island | 50.0% | 16.4%(+33.6)#21 | 24.1%(+25.9)#4,303 |
| 22. | Goldsboro | 50.0% | 16.4%(+33.6)#22 | 24.1%(+25.9)#4,350 |
| 23. | Brookeville | 50.0% | 16.4%(+33.6)#23 | 24.1%(+25.9)#4,385 |
| 24. | Kingstown | 49.3% | 16.4%(+32.9)#24 | 24.1%(+25.2)#4,525 |
| 25. | Eden | 48.1% | 16.4%(+31.7)#25 | 24.1%(+24.0)#4,699 |
| 26. | Crumpton | 47.8% | 16.4%(+31.4)#26 | 24.1%(+23.7)#4,752 |
| 27. | Greensboro | 47.0% | 16.4%(+30.6)#27 | 24.1%(+23.0)#4,901 |
| 28. | East New Market | 45.5% | 16.4%(+29.1)#28 | 24.1%(+21.4)#5,170 |
| 29. | Federalsburg | 44.5% | 16.4%(+28.1)#29 | 24.1%(+20.5)#5,334 |
| 30. | Willards | 44.4% | 16.4%(+28.1)#30 | 24.1%(+20.4)#5,350 |
| 31. | Pittsville | 43.9% | 16.4%(+27.5)#31 | 24.1%(+19.8)#5,484 |
| 32. | Union Bridge | 43.1% | 16.4%(+26.7)#32 | 24.1%(+19.0)#5,642 |
| 33. | Andrews Afb | 43.1% | 16.4%(+26.7)#33 | 24.1%(+19.0)#5,648 |
| 34. | Maugansville | 42.9% | 16.4%(+26.5)#34 | 24.1%(+18.8)#5,667 |
| 35. | Melwood | 42.1% | 16.4%(+25.7)#35 | 24.1%(+18.0)#5,891 |
| 36. | Friendsville | 41.9% | 16.4%(+25.5)#36 | 24.1%(+17.9)#5,940 |
| 37. | Barton | 41.7% | 16.4%(+25.3)#37 | 24.1%(+17.6)#6,003 |
| 38. | Chesapeake City | 40.9% | 16.4%(+24.5)#38 | 24.1%(+16.8)#6,187 |
| 39. | Lexington Park | 40.6% | 16.4%(+24.2)#39 | 24.1%(+16.5)#6,249 |
| 40. | Snow Hill | 40.2% | 16.4%(+23.8)#40 | 24.1%(+16.1)#6,332 |
| 41. | Laytonsville | 40.0% | 16.4%(+23.6)#41 | 24.1%(+15.9)#6,406 |
| 42. | Hagerstown | 39.7% | 16.4%(+23.3)#42 | 24.1%(+15.6)#6,551 |
| 43. | Hancock | 39.6% | 16.4%(+23.2)#43 | 24.1%(+15.5)#6,579 |
| 44. | Callaway | 38.9% | 16.4%(+22.5)#44 | 24.1%(+14.8)#6,724 |
| 45. | Delmar | 38.3% | 16.4%(+21.9)#45 | 24.1%(+14.2)#6,887 |
| 46. | Perryman | 37.9% | 16.4%(+21.6)#46 | 24.1%(+13.9)#6,984 |
| 47. | Vienna | 37.9% | 16.4%(+21.5)#47 | 24.1%(+13.9)#6,997 |
| 48. | Sudlersville | 37.8% | 16.4%(+21.5)#48 | 24.1%(+13.8)#7,014 |
| 49. | Frostburg | 37.5% | 16.4%(+21.1)#49 | 24.1%(+13.4)#7,068 |
| 50. | Grantsville | 37.5% | 16.4%(+21.1)#50 | 24.1%(+13.4)#7,091 |
| 51. | Mountain Lake Park | 37.2% | 16.4%(+20.8)#51 | 24.1%(+13.1)#7,205 |
| 52. | Langley Park | 37.2% | 16.4%(+20.8)#52 | 24.1%(+13.1)#7,207 |
| 53. | Westernport | 37.1% | 16.4%(+20.7)#53 | 24.1%(+13.0)#7,226 |
| 54. | Dundalk | 37.1% | 16.4%(+20.7)#54 | 24.1%(+13.0)#7,230 |
| 55. | Herald Harbor | 36.1% | 16.4%(+19.7)#55 | 24.1%(+12.0)#7,499 |
| 56. | Oxford | 36.1% | 16.4%(+19.7)#56 | 24.1%(+12.0)#7,503 |
| 57. | Fairlee | 36.0% | 16.4%(+19.6)#57 | 24.1%(+11.9)#7,538 |
| 58. | Lansdowne | 35.3% | 16.4%(+18.9)#58 | 24.1%(+11.2)#7,717 |
| 59. | Oakland | 35.1% | 16.4%(+18.7)#59 | 24.1%(+11.0)#7,789 |
| 60. | Aberdeen | 34.9% | 16.4%(+18.5)#60 | 24.1%(+10.8)#7,856 |
| 61. | Easton | 34.6% | 16.4%(+18.2)#61 | 24.1%(+10.5)#7,946 |
| 62. | Cumberland | 34.6% | 16.4%(+18.2)#62 | 24.1%(+10.5)#7,952 |
| 63. | Kensington | 34.4% | 16.4%(+18.0)#63 | 24.1%(+10.3)#7,998 |
| 64. | Taneytown | 34.2% | 16.4%(+17.8)#64 | 24.1%(+10.1)#8,054 |
| 65. | Myersville | 34.1% | 16.4%(+17.8)#65 | 24.1%(+10.1)#8,073 |
| 66. | North East | 33.7% | 16.4%(+17.3)#66 | 24.1%(+9.65)#8,179 |
| 67. | Millington | 33.3% | 16.4%(+16.9)#67 | 24.1%(+9.26)#8,328 |
| 68. | Glen Echo | 33.3% | 16.4%(+16.9)#68 | 24.1%(+9.26)#8,415 |
| 69. | Ballenger Creek | 32.7% | 16.4%(+16.4)#69 | 24.1%(+8.67)#8,659 |
| 70. | Poolesville | 32.7% | 16.4%(+16.3)#70 | 24.1%(+8.59)#8,674 |
| 71. | Crisfield | 32.6% | 16.4%(+16.2)#71 | 24.1%(+8.48)#8,701 |
| 72. | Brentwood | 31.7% | 16.4%(+15.3)#72 | 24.1%(+7.58)#8,984 |
| 73. | Elkton | 31.0% | 16.4%(+14.6)#73 | 24.1%(+6.88)#9,182 |
| 74. | Grasonville | 30.7% | 16.4%(+14.3)#74 | 24.1%(+6.65)#9,289 |
| 75. | Potomac Heights | 29.7% | 16.4%(+13.3)#75 | 24.1%(+5.65)#9,636 |
| 76. | Adelphi | 29.6% | 16.4%(+13.3)#76 | 24.1%(+5.56)#9,662 |
| 77. | Accident | 29.4% | 16.4%(+13.0)#77 | 24.1%(+5.34)#9,760 |
| 78. | Trappe | 29.1% | 16.4%(+12.7)#78 | 24.1%(+5.01)#9,850 |
| 79. | Edgewater | 28.7% | 16.4%(+12.3)#79 | 24.1%(+4.62)#9,961 |
| 80. | University Park | 28.6% | 16.4%(+12.2)#80 | 24.1%(+4.49)#9,991 |
| 81. | Chester | 28.1% | 16.4%(+11.8)#81 | 24.1%(+4.06)#10,202 |
| 82. | Midland | 28.1% | 16.4%(+11.7)#82 | 24.1%(+4.05)#10,215 |
| 83. | Deer Park | 28.0% | 16.4%(+11.6)#83 | 24.1%(+3.92)#10,266 |
| 84. | St James | 27.7% | 16.4%(+11.3)#84 | 24.1%(+3.58)#10,374 |
| 85. | Maryland City | 27.4% | 16.4%(+11.0)#85 | 24.1%(+3.34)#10,457 |
| 86. | Aberdeen Proving Ground | 26.9% | 16.4%(+10.5)#86 | 24.1%(+2.85)#10,633 |
| 87. | Secretary | 26.8% | 16.4%(+10.4)#87 | 24.1%(+2.75)#10,675 |
| 88. | Salisbury | 26.8% | 16.4%(+10.4)#88 | 24.1%(+2.73)#10,680 |
| 89. | National Harbor | 26.5% | 16.4%(+10.2)#89 | 24.1%(+2.47)#10,788 |
| 90. | Kingsville | 26.5% | 16.4%(+10.1)#90 | 24.1%(+2.45)#10,794 |
| 91. | Chestertown | 26.2% | 16.4%(+9.76)#91 | 24.1%(+2.07)#10,918 |
| 92. | Burnt Mills | 25.8% | 16.4%(+9.46)#92 | 24.1%(+1.77)#11,035 |
| 93. | Frederick | 25.1% | 16.4%(+8.76)#93 | 24.1%(+1.07)#11,254 |
| 94. | Jessup | 25.0% | 16.4%(+8.61)#94 | 24.1%(+0.924)#11,273 |
| 95. | Baltimore | 24.8% | 16.4%(+8.45)#95 | 24.1%(+0.756)#11,497 |
| 96. | Cecilton | 24.6% | 16.4%(+8.23)#96 | 24.1%(+0.539)#11,561 |
| 97. | Halfway | 24.0% | 16.4%(+7.64)#97 | 24.1%(-0.054)#11,777 |
| 98. | Ferndale | 23.3% | 16.4%(+6.88)#98 | 24.1%(-0.813)#12,076 |
| 99. | Annapolis | 23.0% | 16.4%(+6.62)#99 | 24.1%(-1.07)#12,198 |
| 100. | Cambridge | 22.9% | 16.4%(+6.47)#100 | 24.1%(-1.22)#12,272 |
Common Questions
What are the Top 10 Cities with the Highest Poverty Level Among Single Females in Maryland?
Top 10 Cities with the Highest Poverty Level Among Single Females in Maryland are:
#1
100.0%
#2
100.0%
#3
100.0%
#4
100.0%
#5
100.0%
#6
85.7%
#7
83.3%
#8
82.5%
#9
75.0%
#10
72.3%
What city has the Highest Poverty Level Among Single Females in Maryland?
Algonquin has the Highest Poverty Level Among Single Females in Maryland with 100.0%.
What is the Poverty Level Among Single Females in the State of Maryland?
Poverty Level Among Single Females in Maryland is 16.4%.
What is the Poverty Level Among Single Females in the United States?
Poverty Level Among Single Females in the United States is 24.1%.