Cities with the Highest Percentage of British West Indian Population in the United States
RELATED REPORTS & OPTIONS
British West Indian
United States
Compare Cities
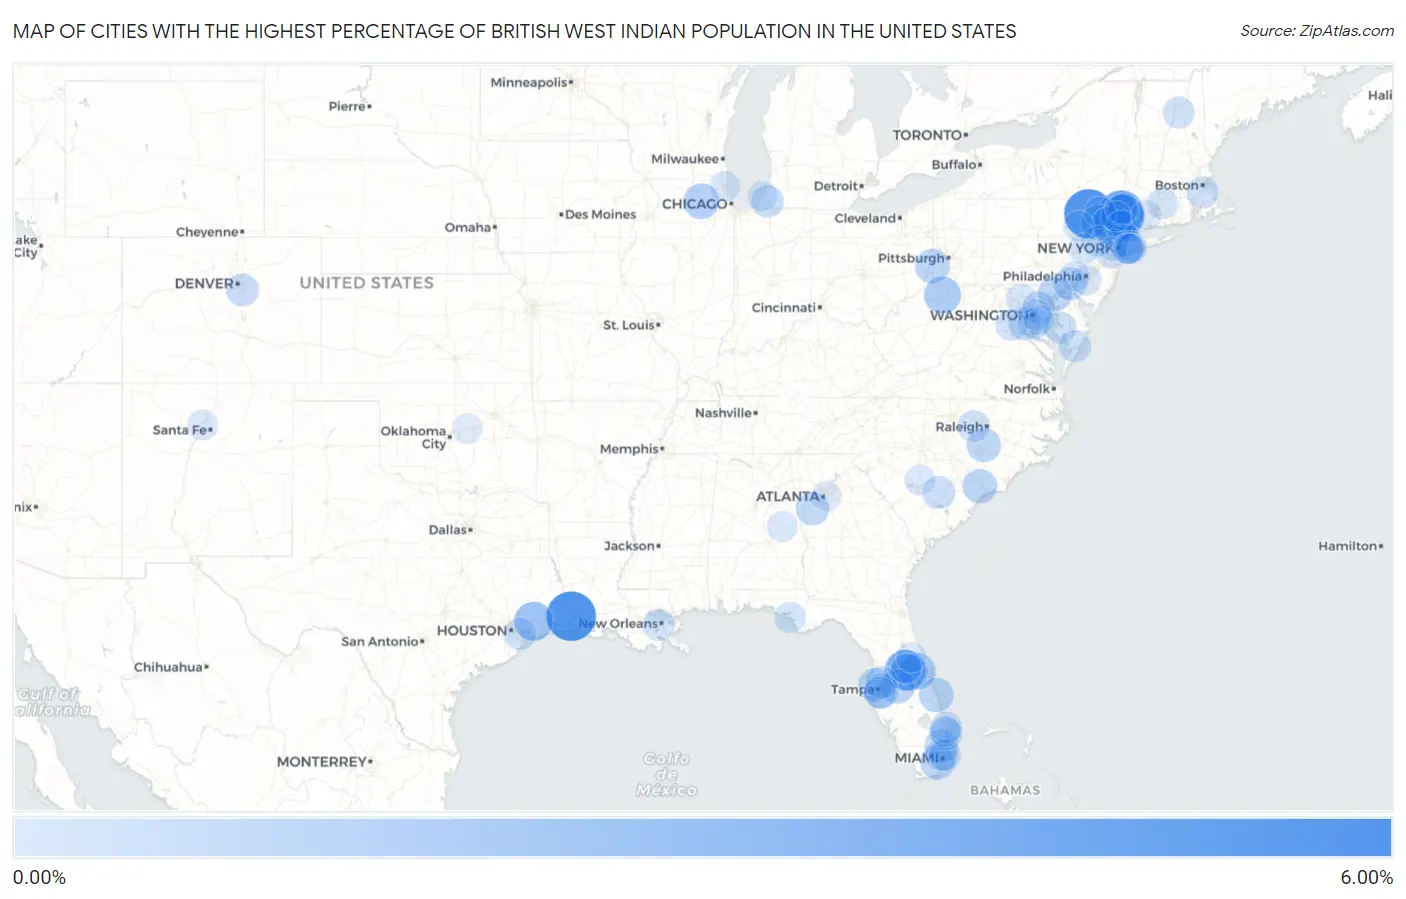
Map of Cities with the Highest Percentage of British West Indian Population in the United States
0.00%
6.00%
Cities with the Highest Percentage of British West Indian Population in the United States
| City | British West Indian | vs State | vs National | |
| 1. | Prien | 5.37% | 0.015%(+5.35)#1 | 0.037%(+5.33)#1 |
| 2. | Narrowsburg | 5.29% | 0.29%(+5.00)#1 | 0.037%(+5.25)#2 |
| 3. | Madison Place | 4.18% | 0.0020%(+4.18)#1 | 0.037%(+4.15)#3 |
| 4. | Spackenkill | 4.13% | 0.29%(+3.84)#2 | 0.037%(+4.09)#4 |
| 5. | Merritt Park | 3.89% | 0.29%(+3.60)#3 | 0.037%(+3.85)#5 |
| 6. | Oakdale Borough | 3.36% | 0.017%(+3.34)#1 | 0.037%(+3.32)#6 |
| 7. | Gotha | 3.05% | 0.081%(+2.97)#1 | 0.037%(+3.01)#7 |
| 8. | Walton Park | 2.90% | 0.29%(+2.61)#4 | 0.037%(+2.86)#8 |
| 9. | Weston | 2.89% | 0.079%(+2.81)#1 | 0.037%(+2.85)#9 |
| 10. | Devers | 2.68% | 0.015%(+2.67)#1 | 0.037%(+2.65)#10 |
| 11. | East Lansdowne Borough | 2.29% | 0.017%(+2.28)#2 | 0.037%(+2.26)#11 |
| 12. | White Hall | 2.24% | 0.0027%(+2.24)#1 | 0.037%(+2.21)#12 |
| 13. | Sky Lake | 2.20% | 0.081%(+2.11)#2 | 0.037%(+2.16)#13 |
| 14. | Wedgefield | 2.07% | 0.081%(+1.99)#3 | 0.037%(+2.03)#14 |
| 15. | Port Jervis | 2.02% | 0.29%(+1.73)#5 | 0.037%(+1.98)#15 |
| 16. | Cortland | 1.94% | 0.0053%(+1.94)#1 | 0.037%(+1.91)#16 |
| 17. | Whitmore | 1.84% | 0.0063%(+1.83)#1 | 0.037%(+1.80)#17 |
| 18. | Bethany | 1.69% | 0.0027%(+1.69)#2 | 0.037%(+1.65)#18 |
| 19. | Orchid | 1.68% | 0.081%(+1.60)#4 | 0.037%(+1.64)#19 |
| 20. | Inwood | 1.67% | 0.081%(+1.59)#5 | 0.037%(+1.64)#20 |
| 21. | Riverside | 1.67% | 0.066%(+1.61)#1 | 0.037%(+1.63)#21 |
| 22. | Progress Village | 1.65% | 0.081%(+1.57)#6 | 0.037%(+1.62)#22 |
| 23. | Richmond Heights | 1.64% | 0.081%(+1.56)#7 | 0.037%(+1.61)#23 |
| 24. | Loris | 1.63% | 0.014%(+1.62)#1 | 0.037%(+1.59)#24 |
| 25. | Linden | 1.59% | 0.017%(+1.57)#1 | 0.037%(+1.55)#25 |
| 26. | Florida | 1.53% | 0.29%(+1.24)#6 | 0.037%(+1.50)#26 |
| 27. | Citrus Park | 1.47% | 0.081%(+1.39)#8 | 0.037%(+1.44)#27 |
| 28. | Lauderhill | 1.43% | 0.081%(+1.35)#9 | 0.037%(+1.39)#28 |
| 29. | Akwesasne | 1.41% | 0.29%(+1.12)#7 | 0.037%(+1.37)#29 |
| 30. | Newnan | 1.40% | 0.058%(+1.34)#1 | 0.037%(+1.36)#30 |
| 31. | South Apopka | 1.37% | 0.081%(+1.29)#10 | 0.037%(+1.34)#31 |
| 32. | Pike Creek Valley | 1.34% | 0.039%(+1.30)#1 | 0.037%(+1.30)#32 |
| 33. | Fairfield Plantation | 1.31% | 0.058%(+1.26)#2 | 0.037%(+1.28)#33 |
| 34. | Crompond | 1.31% | 0.29%(+1.02)#8 | 0.037%(+1.28)#34 |
| 35. | Potomac Mills | 1.31% | 0.017%(+1.29)#1 | 0.037%(+1.27)#35 |
| 36. | Elmont | 1.27% | 0.29%(+0.982)#9 | 0.037%(+1.23)#36 |
| 37. | Mount Vernon | 1.26% | 0.29%(+0.972)#10 | 0.037%(+1.22)#37 |
| 38. | Haviland | 1.26% | 0.29%(+0.969)#11 | 0.037%(+1.22)#38 |
| 39. | Dove Valley | 1.26% | 0.0058%(+1.25)#1 | 0.037%(+1.22)#39 |
| 40. | South Sumter | 1.21% | 0.014%(+1.20)#2 | 0.037%(+1.18)#40 |
| 41. | Maryland City | 1.20% | 0.066%(+1.14)#2 | 0.037%(+1.17)#41 |
| 42. | Pebble Creek | 1.20% | 0.081%(+1.12)#11 | 0.037%(+1.17)#42 |
| 43. | Berrien Springs | 1.19% | 0.0043%(+1.18)#1 | 0.037%(+1.15)#43 |
| 44. | Opa Locka | 1.16% | 0.081%(+1.08)#12 | 0.037%(+1.12)#44 |
| 45. | Cambridge | 1.13% | 0.066%(+1.07)#3 | 0.037%(+1.10)#45 |
| 46. | Pine Brook | 1.11% | 0.077%(+1.03)#1 | 0.037%(+1.07)#46 |
| 47. | San Castle | 1.10% | 0.081%(+1.02)#13 | 0.037%(+1.06)#47 |
| 48. | Holden Lakes | 1.09% | 0.081%(+1.01)#14 | 0.037%(+1.05)#48 |
| 49. | Poughkeepsie | 1.07% | 0.29%(+0.780)#12 | 0.037%(+1.03)#49 |
| 50. | Pocomoke City | 1.07% | 0.066%(+1.000)#4 | 0.037%(+1.03)#50 |
| 51. | Monticello | 1.05% | 0.29%(+0.764)#13 | 0.037%(+1.02)#51 |
| 52. | La Porte | 1.05% | 0.015%(+1.04)#2 | 0.037%(+1.01)#52 |
| 53. | Bay Harbor Islands | 1.04% | 0.081%(+0.963)#15 | 0.037%(+1.01)#53 |
| 54. | Gibsonton | 1.04% | 0.081%(+0.960)#16 | 0.037%(+1.00)#54 |
| 55. | Randolph Town | 1.03% | 0.065%(+0.969)#1 | 0.037%(+0.998)#55 |
| 56. | Lisbon | 1.03% | 0.0062%(+1.03)#1 | 0.037%(+0.996)#56 |
| 57. | Flower Hill | 1.03% | 0.066%(+0.966)#5 | 0.037%(+0.996)#57 |
| 58. | Mangonia Park | 1.03% | 0.081%(+0.945)#17 | 0.037%(+0.989)#58 |
| 59. | Accokeek | 1.01% | 0.066%(+0.946)#6 | 0.037%(+0.976)#59 |
| 60. | Fearrington Village | 1.01% | 0.017%(+0.990)#2 | 0.037%(+0.970)#60 |
| 61. | Bridge City | 0.98% | 0.015%(+0.968)#2 | 0.037%(+0.947)#61 |
| 62. | Pleasant Valley | 0.97% | 0.29%(+0.685)#14 | 0.037%(+0.937)#62 |
| 63. | East Orange | 0.96% | 0.077%(+0.884)#2 | 0.037%(+0.925)#63 |
| 64. | West Easton Borough | 0.96% | 0.017%(+0.943)#3 | 0.037%(+0.923)#64 |
| 65. | Peekskill | 0.96% | 0.29%(+0.668)#15 | 0.037%(+0.920)#65 |
| 66. | Palm Springs | 0.96% | 0.081%(+0.875)#18 | 0.037%(+0.919)#66 |
| 67. | Port Reading | 0.94% | 0.077%(+0.864)#3 | 0.037%(+0.904)#67 |
| 68. | Fairmount Heights | 0.94% | 0.066%(+0.874)#7 | 0.037%(+0.903)#68 |
| 69. | Freehold Borough | 0.94% | 0.077%(+0.859)#4 | 0.037%(+0.900)#69 |
| 70. | Opal | 0.93% | 0.017%(+0.909)#2 | 0.037%(+0.889)#70 |
| 71. | Fairview Cdp Westchester County | 0.92% | 0.29%(+0.631)#16 | 0.037%(+0.883)#71 |
| 72. | Callaway | 0.91% | 0.081%(+0.826)#19 | 0.037%(+0.870)#72 |
| 73. | Rockville | 0.89% | 0.079%(+0.813)#2 | 0.037%(+0.855)#73 |
| 74. | Budd Lake | 0.86% | 0.077%(+0.785)#5 | 0.037%(+0.825)#74 |
| 75. | North Valley Stream | 0.86% | 0.29%(+0.569)#17 | 0.037%(+0.821)#75 |
| 76. | Pocono Springs | 0.82% | 0.017%(+0.805)#4 | 0.037%(+0.785)#76 |
| 77. | Pine Hills | 0.81% | 0.081%(+0.732)#20 | 0.037%(+0.776)#77 |
| 78. | Mountainside Borough | 0.80% | 0.077%(+0.724)#6 | 0.037%(+0.764)#78 |
| 79. | New Cassel | 0.79% | 0.29%(+0.505)#18 | 0.037%(+0.757)#79 |
| 80. | Bard College | 0.76% | 0.29%(+0.474)#19 | 0.037%(+0.726)#80 |
| 81. | White Rock | 0.75% | 0.0045%(+0.747)#1 | 0.037%(+0.715)#81 |
| 82. | Easton | 0.75% | 0.017%(+0.731)#5 | 0.037%(+0.711)#82 |
| 83. | Woodlawn Cdp Prince George S County | 0.75% | 0.066%(+0.679)#8 | 0.037%(+0.709)#83 |
| 84. | Jacksons Gap | 0.74% | 0.0038%(+0.741)#1 | 0.037%(+0.708)#84 |
| 85. | Roosevelt | 0.74% | 0.29%(+0.455)#20 | 0.037%(+0.707)#85 |
| 86. | Rosaryville | 0.74% | 0.066%(+0.674)#9 | 0.037%(+0.704)#86 |
| 87. | Woodbury | 0.73% | 0.077%(+0.655)#7 | 0.037%(+0.695)#87 |
| 88. | Westwood Borough | 0.73% | 0.077%(+0.653)#8 | 0.037%(+0.693)#88 |
| 89. | Buckeystown | 0.73% | 0.066%(+0.663)#10 | 0.037%(+0.692)#89 |
| 90. | Blythewood | 0.70% | 0.014%(+0.681)#3 | 0.037%(+0.659)#90 |
| 91. | North Chicago | 0.69% | 0.0053%(+0.687)#2 | 0.037%(+0.656)#91 |
| 92. | Avondale Estates | 0.68% | 0.058%(+0.626)#3 | 0.037%(+0.648)#92 |
| 93. | Orange City | 0.66% | 0.081%(+0.583)#21 | 0.037%(+0.627)#93 |
| 94. | Chandler | 0.66% | 0.0053%(+0.653)#1 | 0.037%(+0.622)#94 |
| 95. | Brown Station | 0.66% | 0.066%(+0.592)#11 | 0.037%(+0.621)#95 |
| 96. | Cheyney University | 0.66% | 0.017%(+0.641)#6 | 0.037%(+0.621)#96 |
| 97. | Lakeview | 0.66% | 0.29%(+0.368)#21 | 0.037%(+0.620)#97 |
| 98. | Shoreham | 0.65% | 0.0043%(+0.647)#2 | 0.037%(+0.615)#98 |
| 99. | Waterbury | 0.65% | 0.079%(+0.570)#3 | 0.037%(+0.612)#99 |
| 100. | Orange Lake | 0.65% | 0.29%(+0.358)#22 | 0.037%(+0.610)#100 |
Common Questions
What are the Top 10 Cities with the Highest Percentage of British West Indian Population in the United States?
Top 10 Cities with the Highest Percentage of British West Indian Population in the United States are:
#1
5.37%
#2
5.29%
#3
4.13%
#4
3.89%
#5
3.05%
#6
2.90%
#7
2.68%
#8
2.24%
#9
2.20%
#10
2.07%
What city has the Highest Percentage of British West Indian Population in the United States?
Prien has the Highest Percentage of British West Indian Population in the United States with 5.37%.
What is the Percentage of British West Indian Population in the United States?
Percentage of British West Indian Population in the United States is 0.037%.