Cities with the Highest Percentage of British West Indian Population in Maryland
RELATED REPORTS & OPTIONS
British West Indian
Maryland
Compare Cities
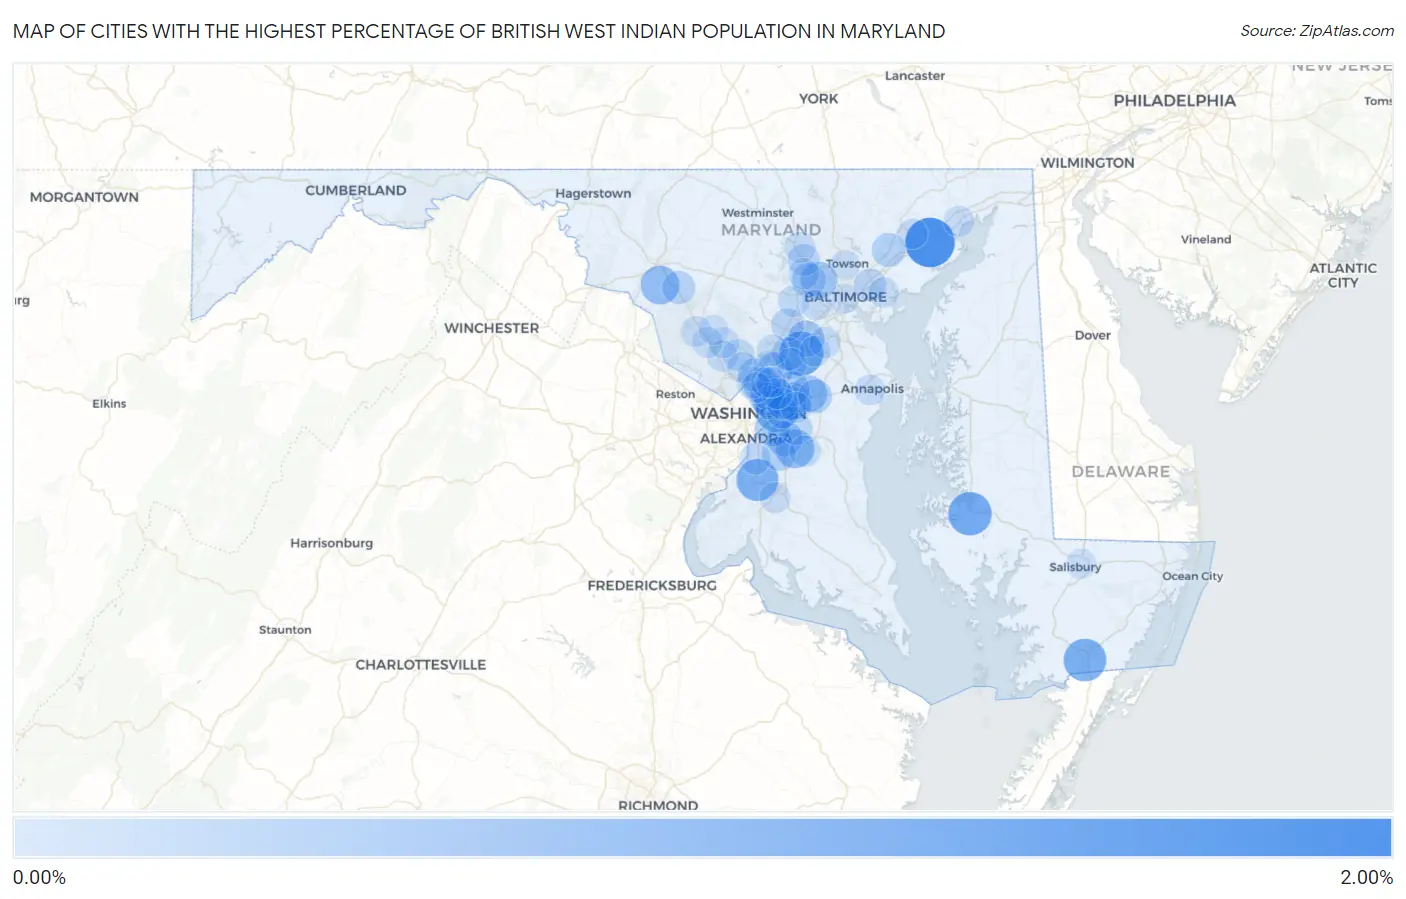
Map of Cities with the Highest Percentage of British West Indian Population in Maryland
0.00%
2.00%
Cities with the Highest Percentage of British West Indian Population in Maryland
| City | British West Indian | vs State | vs National | |
| 1. | Riverside | 1.67% | 0.066%(+1.61)#1 | 0.037%(+1.63)#21 |
| 2. | Maryland City | 1.20% | 0.066%(+1.14)#2 | 0.037%(+1.17)#41 |
| 3. | Cambridge | 1.13% | 0.066%(+1.07)#3 | 0.037%(+1.10)#45 |
| 4. | Pocomoke City | 1.07% | 0.066%(+1.000)#4 | 0.037%(+1.03)#50 |
| 5. | Flower Hill | 1.03% | 0.066%(+0.966)#5 | 0.037%(+0.996)#57 |
| 6. | Accokeek | 1.01% | 0.066%(+0.946)#6 | 0.037%(+0.976)#59 |
| 7. | Fairmount Heights | 0.94% | 0.066%(+0.874)#7 | 0.037%(+0.903)#68 |
| 8. | Woodlawn Cdp Prince George S County | 0.75% | 0.066%(+0.679)#8 | 0.037%(+0.709)#83 |
| 9. | Rosaryville | 0.74% | 0.066%(+0.674)#9 | 0.037%(+0.704)#86 |
| 10. | Buckeystown | 0.73% | 0.066%(+0.663)#10 | 0.037%(+0.692)#89 |
| 11. | Brown Station | 0.66% | 0.066%(+0.592)#11 | 0.037%(+0.621)#95 |
| 12. | Springdale | 0.61% | 0.066%(+0.540)#12 | 0.037%(+0.570)#112 |
| 13. | Fairwood | 0.55% | 0.066%(+0.483)#13 | 0.037%(+0.512)#129 |
| 14. | Lochearn | 0.54% | 0.066%(+0.477)#14 | 0.037%(+0.506)#133 |
| 15. | Jessup | 0.51% | 0.066%(+0.445)#15 | 0.037%(+0.474)#141 |
| 16. | Beltsville | 0.46% | 0.066%(+0.391)#16 | 0.037%(+0.420)#150 |
| 17. | Andrews Afb | 0.45% | 0.066%(+0.386)#17 | 0.037%(+0.415)#155 |
| 18. | Brentwood | 0.45% | 0.066%(+0.384)#18 | 0.037%(+0.413)#157 |
| 19. | Langley Park | 0.43% | 0.066%(+0.361)#19 | 0.037%(+0.390)#161 |
| 20. | Silver Hill | 0.42% | 0.066%(+0.356)#20 | 0.037%(+0.385)#162 |
| 21. | Glenarden | 0.41% | 0.066%(+0.345)#21 | 0.037%(+0.374)#169 |
| 22. | Seabrook | 0.38% | 0.066%(+0.311)#22 | 0.037%(+0.340)#181 |
| 23. | Cottage City | 0.36% | 0.066%(+0.293)#23 | 0.037%(+0.322)#191 |
| 24. | Milford Mill | 0.35% | 0.066%(+0.286)#24 | 0.037%(+0.316)#194 |
| 25. | Clinton | 0.33% | 0.066%(+0.260)#25 | 0.037%(+0.289)#207 |
| 26. | Bowie | 0.32% | 0.066%(+0.259)#26 | 0.037%(+0.288)#208 |
| 27. | Kingsville | 0.32% | 0.066%(+0.257)#27 | 0.037%(+0.286)#210 |
| 28. | Riverdale Park | 0.29% | 0.066%(+0.223)#28 | 0.037%(+0.252)#232 |
| 29. | Hyattsville | 0.28% | 0.066%(+0.212)#29 | 0.037%(+0.242)#241 |
| 30. | Four Corners | 0.27% | 0.066%(+0.205)#30 | 0.037%(+0.234)#244 |
| 31. | Colmar Manor | 0.26% | 0.066%(+0.198)#31 | 0.037%(+0.227)#249 |
| 32. | Urbana | 0.26% | 0.066%(+0.196)#32 | 0.037%(+0.225)#250 |
| 33. | Columbia | 0.22% | 0.066%(+0.158)#33 | 0.037%(+0.188)#278 |
| 34. | Laurel | 0.22% | 0.066%(+0.157)#34 | 0.037%(+0.187)#281 |
| 35. | Westphalia | 0.20% | 0.066%(+0.130)#35 | 0.037%(+0.159)#311 |
| 36. | Rosedale | 0.19% | 0.066%(+0.129)#36 | 0.037%(+0.158)#314 |
| 37. | Owings Mills | 0.17% | 0.066%(+0.103)#37 | 0.037%(+0.132)#338 |
| 38. | Peppermill Village | 0.16% | 0.066%(+0.094)#38 | 0.037%(+0.123)#355 |
| 39. | Aspen Hill | 0.15% | 0.066%(+0.082)#39 | 0.037%(+0.111)#369 |
| 40. | Fort Washington | 0.13% | 0.066%(+0.066)#40 | 0.037%(+0.095)#394 |
| 41. | Silver Spring | 0.12% | 0.066%(+0.058)#41 | 0.037%(+0.087)#405 |
| 42. | Landover | 0.11% | 0.066%(+0.049)#42 | 0.037%(+0.078)#426 |
| 43. | Ellicott City | 0.11% | 0.066%(+0.048)#43 | 0.037%(+0.078)#428 |
| 44. | South Laurel | 0.11% | 0.066%(+0.047)#44 | 0.037%(+0.076)#429 |
| 45. | Marlton | 0.11% | 0.066%(+0.042)#45 | 0.037%(+0.072)#441 |
| 46. | Reisterstown | 0.10% | 0.066%(+0.036)#46 | 0.037%(+0.065)#454 |
| 47. | Rockville | 0.098% | 0.066%(+0.033)#47 | 0.037%(+0.062)#463 |
| 48. | Calverton | 0.098% | 0.066%(+0.032)#48 | 0.037%(+0.062)#464 |
| 49. | Wheaton | 0.091% | 0.066%(+0.025)#49 | 0.037%(+0.054)#486 |
| 50. | Severn | 0.090% | 0.066%(+0.025)#50 | 0.037%(+0.054)#491 |
| 51. | Randallstown | 0.086% | 0.066%(+0.020)#51 | 0.037%(+0.049)#499 |
| 52. | Redland | 0.082% | 0.066%(+0.016)#52 | 0.037%(+0.045)#510 |
| 53. | Burtonsville | 0.078% | 0.066%(+0.012)#53 | 0.037%(+0.041)#527 |
| 54. | Gaithersburg | 0.071% | 0.066%(+0.005)#54 | 0.037%(+0.034)#547 |
| 55. | Germantown | 0.071% | 0.066%(+0.005)#55 | 0.037%(+0.034)#548 |
| 56. | Havre De Grace | 0.068% | 0.066%(+0.002)#56 | 0.037%(+0.031)#561 |
| 57. | Lake Arbor | 0.067% | 0.066%(+0.001)#57 | 0.037%(+0.031)#566 |
| 58. | Fort Meade | 0.060% | 0.066%(-0.006)#58 | 0.037%(+0.023)#595 |
| 59. | Waldorf | 0.057% | 0.066%(-0.009)#59 | 0.037%(+0.020)#602 |
| 60. | Annapolis | 0.056% | 0.066%(-0.009)#60 | 0.037%(+0.020)#604 |
| 61. | East Riverdale | 0.050% | 0.066%(-0.016)#61 | 0.037%(+0.013)#637 |
| 62. | Essex | 0.049% | 0.066%(-0.017)#62 | 0.037%(+0.012)#640 |
| 63. | Adelphi | 0.041% | 0.066%(-0.024)#63 | 0.037%(+0.005)#674 |
| 64. | Baltimore | 0.036% | 0.066%(-0.029)#64 | 0.037%(-0.000)#695 |
| 65. | Takoma Park | 0.034% | 0.066%(-0.032)#65 | 0.037%(-0.002)#710 |
| 66. | Bel Air South | 0.026% | 0.066%(-0.039)#66 | 0.037%(-0.010)#759 |
| 67. | College Park | 0.026% | 0.066%(-0.040)#67 | 0.037%(-0.010)#761 |
| 68. | Catonsville | 0.026% | 0.066%(-0.040)#68 | 0.037%(-0.011)#765 |
| 69. | Woodlawn Cdp Baltimore County | 0.021% | 0.066%(-0.044)#69 | 0.037%(-0.015)#788 |
| 70. | Montgomery Village | 0.017% | 0.066%(-0.048)#70 | 0.037%(-0.019)#816 |
| 71. | Salisbury | 0.0061% | 0.066%(-0.060)#71 | 0.037%(-0.030)#908 |
| 72. | Towson | 0.0052% | 0.066%(-0.061)#72 | 0.037%(-0.031)#915 |
Common Questions
What are the Top 10 Cities with the Highest Percentage of British West Indian Population in Maryland?
Top 10 Cities with the Highest Percentage of British West Indian Population in Maryland are:
#1
1.67%
#2
1.20%
#3
1.13%
#4
1.07%
#5
1.01%
#6
0.94%
#7
0.74%
#8
0.73%
#9
0.61%
#10
0.55%
What city has the Highest Percentage of British West Indian Population in Maryland?
Riverside has the Highest Percentage of British West Indian Population in Maryland with 1.67%.
What is the Percentage of British West Indian Population in the State of Maryland?
Percentage of British West Indian Population in Maryland is 0.066%.
What is the Percentage of British West Indian Population in the United States?
Percentage of British West Indian Population in the United States is 0.037%.