Cities with the Most Immigrants from El Salvador in Louisiana
RELATED REPORTS & OPTIONS
El Salvador
Louisiana
Compare Cities
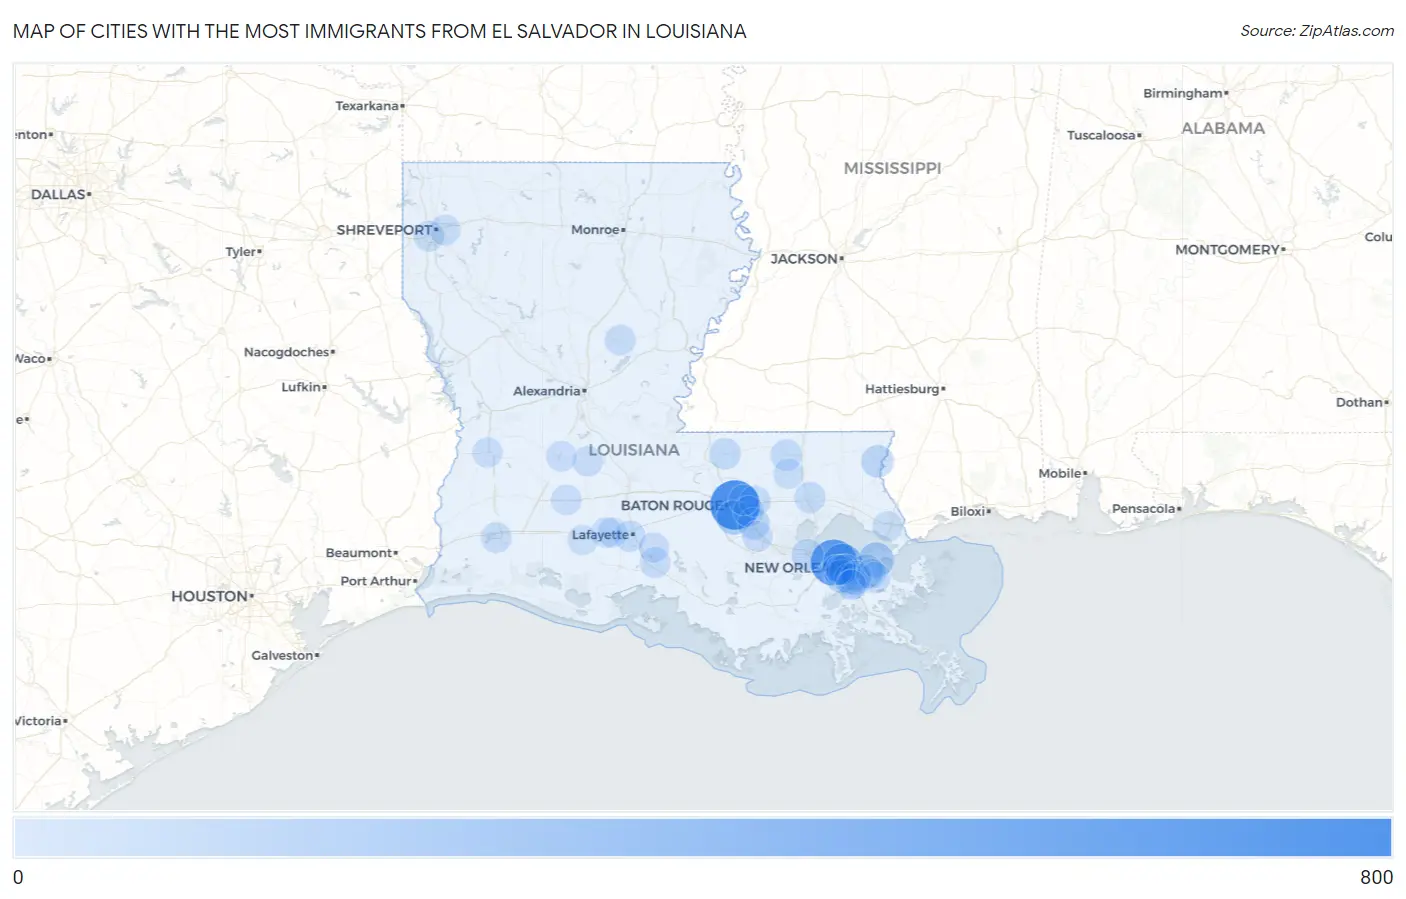
Map of Cities with the Most Immigrants from El Salvador in Louisiana
0
800
Cities with the Most Immigrants from El Salvador in Louisiana
| City | El Salvador | vs State | vs National | |
| 1. | Baton Rouge | 652 | 4,241(15.37%)#1 | 1,408,349(0.05%)#314 |
| 2. | Kenner | 535 | 4,241(12.61%)#2 | 1,408,349(0.04%)#385 |
| 3. | Metairie | 327 | 4,241(7.71%)#3 | 1,408,349(0.02%)#602 |
| 4. | New Orleans | 160 | 4,241(3.77%)#4 | 1,408,349(0.01%)#986 |
| 5. | Gardere | 142 | 4,241(3.35%)#5 | 1,408,349(0.01%)#1,066 |
| 6. | Chalmette | 118 | 4,241(2.78%)#6 | 1,408,349(0.01%)#1,189 |
| 7. | Avondale | 85 | 4,241(2.00%)#7 | 1,408,349(0.01%)#1,433 |
| 8. | Bogalusa | 73 | 4,241(1.72%)#8 | 1,408,349(0.01%)#1,545 |
| 9. | Laplace | 62 | 4,241(1.46%)#9 | 1,408,349(0.00%)#1,692 |
| 10. | Prairieville | 56 | 4,241(1.32%)#10 | 1,408,349(0.00%)#1,783 |
| 11. | Harvey | 49 | 4,241(1.16%)#11 | 1,408,349(0.00%)#1,902 |
| 12. | Jackson | 46 | 4,241(1.08%)#12 | 1,408,349(0.00%)#1,957 |
| 13. | Greensburg | 41 | 4,241(0.97%)#13 | 1,408,349(0.00%)#2,061 |
| 14. | Jefferson | 38 | 4,241(0.90%)#14 | 1,408,349(0.00%)#2,115 |
| 15. | Lafayette | 31 | 4,241(0.73%)#15 | 1,408,349(0.00%)#2,258 |
| 16. | Denham Springs | 31 | 4,241(0.73%)#16 | 1,408,349(0.00%)#2,278 |
| 17. | Violet | 30 | 4,241(0.71%)#17 | 1,408,349(0.00%)#2,312 |
| 18. | Marrero | 29 | 4,241(0.68%)#18 | 1,408,349(0.00%)#2,327 |
| 19. | Hammond | 29 | 4,241(0.68%)#19 | 1,408,349(0.00%)#2,332 |
| 20. | Shenandoah | 24 | 4,241(0.57%)#20 | 1,408,349(0.00%)#2,478 |
| 21. | Jena | 24 | 4,241(0.57%)#21 | 1,408,349(0.00%)#2,500 |
| 22. | Shreveport | 23 | 4,241(0.54%)#22 | 1,408,349(0.00%)#2,508 |
| 23. | Bossier City | 23 | 4,241(0.54%)#23 | 1,408,349(0.00%)#2,511 |
| 24. | Gretna | 23 | 4,241(0.54%)#24 | 1,408,349(0.00%)#2,521 |
| 25. | Lake Charles | 22 | 4,241(0.52%)#25 | 1,408,349(0.00%)#2,551 |
| 26. | New Iberia | 20 | 4,241(0.47%)#26 | 1,408,349(0.00%)#2,642 |
| 27. | Gonzales | 16 | 4,241(0.38%)#27 | 1,408,349(0.00%)#2,826 |
| 28. | Basile | 16 | 4,241(0.38%)#28 | 1,408,349(0.00%)#2,845 |
| 29. | Oakdale | 15 | 4,241(0.35%)#29 | 1,408,349(0.00%)#2,898 |
| 30. | Monticello | 15 | 4,241(0.35%)#30 | 1,408,349(0.00%)#2,903 |
| 31. | Woodmere | 13 | 4,241(0.31%)#31 | 1,408,349(0.00%)#3,006 |
| 32. | Rayne | 12 | 4,241(0.28%)#32 | 1,408,349(0.00%)#3,085 |
| 33. | Pine Prairie | 11 | 4,241(0.26%)#33 | 1,408,349(0.00%)#3,157 |
| 34. | River Ridge | 9 | 4,241(0.21%)#34 | 1,408,349(0.00%)#3,256 |
| 35. | Deridder | 9 | 4,241(0.21%)#35 | 1,408,349(0.00%)#3,261 |
| 36. | St Martinville | 9 | 4,241(0.21%)#36 | 1,408,349(0.00%)#3,274 |
| 37. | Slidell | 8 | 4,241(0.19%)#37 | 1,408,349(0.00%)#3,327 |
| 38. | Elmwood | 8 | 4,241(0.19%)#38 | 1,408,349(0.00%)#3,358 |
| 39. | Montpelier | 7 | 4,241(0.17%)#39 | 1,408,349(0.00%)#3,475 |
| 40. | Estherwood | 4 | 4,241(0.09%)#40 | 1,408,349(0.00%)#3,704 |
| 41. | Duson | 3 | 4,241(0.07%)#41 | 1,408,349(0.00%)#3,754 |
| 42. | Meraux | 2 | 4,241(0.05%)#42 | 1,408,349(0.00%)#3,796 |
| 43. | Estelle | 1 | 4,241(0.02%)#43 | 1,408,349(0.00%)#3,871 |
Common Questions
What are the Top 10 Cities with the Most Immigrants from El Salvador in Louisiana?
Top 10 Cities with the Most Immigrants from El Salvador in Louisiana are:
#1
652
#2
535
#3
327
#4
160
#5
142
#6
118
#7
85
#8
73
#9
62
#10
56
What city has the Most Immigrants from El Salvador in Louisiana?
Baton Rouge has the Most Immigrants from El Salvador in Louisiana with 652.
What is the Total Immigrants from El Salvador in the State of Louisiana?
Total Immigrants from El Salvador in Louisiana is 4,241.
What is the Total Immigrants from El Salvador in the United States?
Total Immigrants from El Salvador in the United States is 1,408,349.