Cities with the Most Immigrants from El Salvador in Tennessee
RELATED REPORTS & OPTIONS
El Salvador
Tennessee
Compare Cities
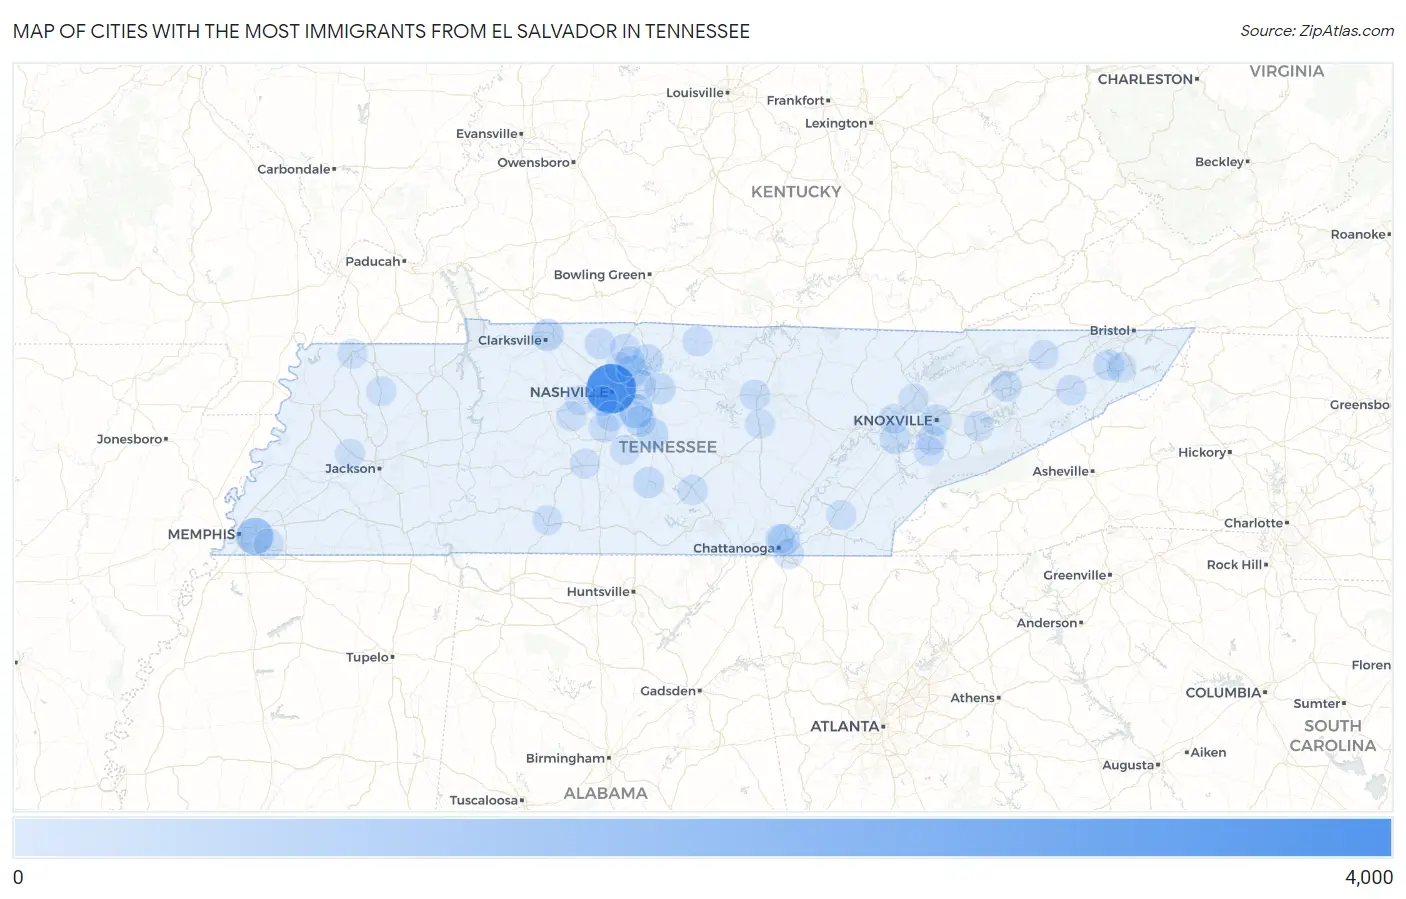
Map of Cities with the Most Immigrants from El Salvador in Tennessee
0
4,000
Cities with the Most Immigrants from El Salvador in Tennessee
| City | El Salvador | vs State | vs National | |
| 1. | Nashville | 3,695 | 10,313(35.83%)#1 | 1,408,349(0.26%)#44 |
| 2. | Memphis | 1,252 | 10,313(12.14%)#2 | 1,408,349(0.09%)#184 |
| 3. | La Vergne | 720 | 10,313(6.98%)#3 | 1,408,349(0.05%)#297 |
| 4. | Clarksville | 370 | 10,313(3.59%)#4 | 1,408,349(0.03%)#534 |
| 5. | Hendersonville | 318 | 10,313(3.08%)#5 | 1,408,349(0.02%)#619 |
| 6. | Murfreesboro | 276 | 10,313(2.68%)#6 | 1,408,349(0.02%)#689 |
| 7. | Smyrna | 254 | 10,313(2.46%)#7 | 1,408,349(0.02%)#730 |
| 8. | Gallatin | 246 | 10,313(2.39%)#8 | 1,408,349(0.02%)#746 |
| 9. | Chattanooga | 218 | 10,313(2.11%)#9 | 1,408,349(0.02%)#809 |
| 10. | Shelbyville | 190 | 10,313(1.84%)#10 | 1,408,349(0.01%)#874 |
| 11. | Knoxville | 172 | 10,313(1.67%)#11 | 1,408,349(0.01%)#937 |
| 12. | Johnson City | 171 | 10,313(1.66%)#12 | 1,408,349(0.01%)#944 |
| 13. | Lebanon | 169 | 10,313(1.64%)#13 | 1,408,349(0.01%)#951 |
| 14. | Springfield | 141 | 10,313(1.37%)#14 | 1,408,349(0.01%)#1,069 |
| 15. | Morristown | 136 | 10,313(1.32%)#15 | 1,408,349(0.01%)#1,094 |
| 16. | Lenoir City | 129 | 10,313(1.25%)#16 | 1,408,349(0.01%)#1,131 |
| 17. | Cookeville | 100 | 10,313(0.97%)#17 | 1,408,349(0.01%)#1,302 |
| 18. | Manchester | 73 | 10,313(0.71%)#18 | 1,408,349(0.01%)#1,544 |
| 19. | Franklin | 58 | 10,313(0.56%)#19 | 1,408,349(0.00%)#1,749 |
| 20. | Alcoa | 58 | 10,313(0.56%)#20 | 1,408,349(0.00%)#1,755 |
| 21. | Brentwood | 55 | 10,313(0.53%)#21 | 1,408,349(0.00%)#1,800 |
| 22. | Mount Juliet | 45 | 10,313(0.44%)#22 | 1,408,349(0.00%)#1,971 |
| 23. | East Ridge | 41 | 10,313(0.40%)#23 | 1,408,349(0.00%)#2,042 |
| 24. | Lafayette | 38 | 10,313(0.37%)#24 | 1,408,349(0.00%)#2,124 |
| 25. | White House | 37 | 10,313(0.36%)#25 | 1,408,349(0.00%)#2,141 |
| 26. | Tusculum | 34 | 10,313(0.33%)#26 | 1,408,349(0.00%)#2,209 |
| 27. | Goodlettsville | 27 | 10,313(0.26%)#27 | 1,408,349(0.00%)#2,383 |
| 28. | Sevierville | 23 | 10,313(0.22%)#28 | 1,408,349(0.00%)#2,520 |
| 29. | Clinton | 23 | 10,313(0.22%)#29 | 1,408,349(0.00%)#2,529 |
| 30. | Central | 20 | 10,313(0.19%)#30 | 1,408,349(0.00%)#2,680 |
| 31. | Pegram | 14 | 10,313(0.14%)#31 | 1,408,349(0.00%)#2,965 |
| 32. | Oak Ridge | 8 | 10,313(0.08%)#32 | 1,408,349(0.00%)#3,325 |
| 33. | Union City | 8 | 10,313(0.08%)#33 | 1,408,349(0.00%)#3,343 |
| 34. | Rogersville | 8 | 10,313(0.08%)#34 | 1,408,349(0.00%)#3,366 |
| 35. | Bells | 7 | 10,313(0.07%)#35 | 1,408,349(0.00%)#3,450 |
| 36. | Columbia | 6 | 10,313(0.06%)#36 | 1,408,349(0.00%)#3,481 |
| 37. | Powell | 6 | 10,313(0.06%)#37 | 1,408,349(0.00%)#3,502 |
| 38. | Red Bank | 6 | 10,313(0.06%)#38 | 1,408,349(0.00%)#3,504 |
| 39. | Maryville | 5 | 10,313(0.05%)#39 | 1,408,349(0.00%)#3,568 |
| 40. | Sparta | 5 | 10,313(0.05%)#40 | 1,408,349(0.00%)#3,590 |
| 41. | Lawrenceburg | 4 | 10,313(0.04%)#41 | 1,408,349(0.00%)#3,652 |
| 42. | Belle Meade | 4 | 10,313(0.04%)#42 | 1,408,349(0.00%)#3,663 |
| 43. | Greenfield | 4 | 10,313(0.04%)#43 | 1,408,349(0.00%)#3,672 |
| 44. | Germantown | 3 | 10,313(0.03%)#44 | 1,408,349(0.00%)#3,721 |
| 45. | Shackle Island | 3 | 10,313(0.03%)#45 | 1,408,349(0.00%)#3,734 |
| 46. | Eagleville | 3 | 10,313(0.03%)#46 | 1,408,349(0.00%)#3,763 |
| 47. | Fairview | 2 | 10,313(0.02%)#47 | 1,408,349(0.00%)#3,793 |
| 48. | Charleston | 1 | 10,313(0.01%)#48 | 1,408,349(0.00%)#3,912 |
Common Questions
What are the Top 10 Cities with the Most Immigrants from El Salvador in Tennessee?
Top 10 Cities with the Most Immigrants from El Salvador in Tennessee are:
#1
3,695
#2
1,252
#3
720
#4
370
#5
318
#6
276
#7
254
#8
246
#9
218
#10
190
What city has the Most Immigrants from El Salvador in Tennessee?
Nashville has the Most Immigrants from El Salvador in Tennessee with 3,695.
What is the Total Immigrants from El Salvador in the State of Tennessee?
Total Immigrants from El Salvador in Tennessee is 10,313.
What is the Total Immigrants from El Salvador in the United States?
Total Immigrants from El Salvador in the United States is 1,408,349.