Cities with the Most Immigrants from El Salvador in Iowa
RELATED REPORTS & OPTIONS
El Salvador
Iowa
Compare Cities
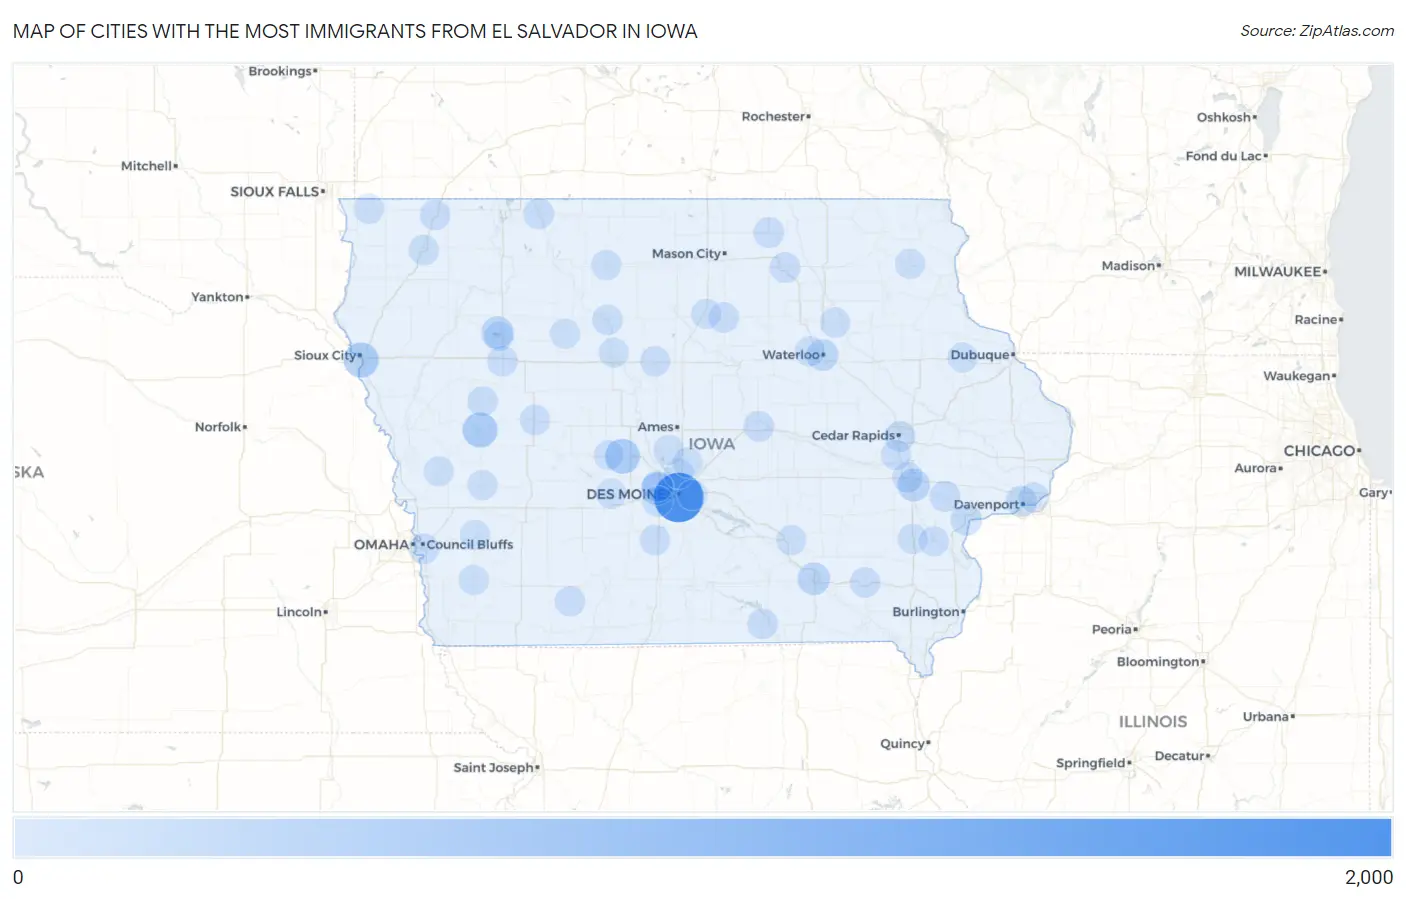
Map of Cities with the Most Immigrants from El Salvador in Iowa
0
2,000
Cities with the Most Immigrants from El Salvador in Iowa
| City | El Salvador | vs State | vs National | |
| 1. | Des Moines | 1,698 | 4,967(34.19%)#1 | 1,408,349(0.12%)#130 |
| 2. | Sioux City | 410 | 4,967(8.25%)#2 | 1,408,349(0.03%)#474 |
| 3. | Denison | 403 | 4,967(8.11%)#3 | 1,408,349(0.03%)#490 |
| 4. | Perry | 393 | 4,967(7.91%)#4 | 1,408,349(0.03%)#504 |
| 5. | Clive | 219 | 4,967(4.41%)#5 | 1,408,349(0.02%)#808 |
| 6. | Iowa City | 198 | 4,967(3.99%)#6 | 1,408,349(0.01%)#854 |
| 7. | Ottumwa | 187 | 4,967(3.76%)#7 | 1,408,349(0.01%)#886 |
| 8. | Storm Lake | 180 | 4,967(3.62%)#8 | 1,408,349(0.01%)#902 |
| 9. | Waterloo | 139 | 4,967(2.80%)#9 | 1,408,349(0.01%)#1,080 |
| 10. | Davenport | 93 | 4,967(1.87%)#10 | 1,408,349(0.01%)#1,355 |
| 11. | Muscatine | 88 | 4,967(1.77%)#11 | 1,408,349(0.01%)#1,400 |
| 12. | West Liberty | 65 | 4,967(1.31%)#12 | 1,408,349(0.00%)#1,659 |
| 13. | Cedar Rapids | 48 | 4,967(0.97%)#13 | 1,408,349(0.00%)#1,911 |
| 14. | Urbandale | 44 | 4,967(0.89%)#14 | 1,408,349(0.00%)#1,983 |
| 15. | Centerville | 42 | 4,967(0.85%)#15 | 1,408,349(0.00%)#2,030 |
| 16. | Osage | 42 | 4,967(0.85%)#16 | 1,408,349(0.00%)#2,033 |
| 17. | Charles City | 41 | 4,967(0.83%)#17 | 1,408,349(0.00%)#2,052 |
| 18. | West Des Moines | 38 | 4,967(0.77%)#18 | 1,408,349(0.00%)#2,106 |
| 19. | Hampton | 38 | 4,967(0.77%)#19 | 1,408,349(0.00%)#2,125 |
| 20. | Council Bluffs | 36 | 4,967(0.72%)#20 | 1,408,349(0.00%)#2,158 |
| 21. | Marshalltown | 35 | 4,967(0.70%)#21 | 1,408,349(0.00%)#2,182 |
| 22. | St Charles | 32 | 4,967(0.64%)#22 | 1,408,349(0.00%)#2,255 |
| 23. | Estherville | 31 | 4,967(0.62%)#23 | 1,408,349(0.00%)#2,286 |
| 24. | Bettendorf | 29 | 4,967(0.58%)#24 | 1,408,349(0.00%)#2,325 |
| 25. | Early | 28 | 4,967(0.56%)#25 | 1,408,349(0.00%)#2,375 |
| 26. | Sibley | 25 | 4,967(0.50%)#26 | 1,408,349(0.00%)#2,463 |
| 27. | Carroll | 23 | 4,967(0.46%)#27 | 1,408,349(0.00%)#2,528 |
| 28. | Humboldt | 22 | 4,967(0.44%)#28 | 1,408,349(0.00%)#2,577 |
| 29. | Webster City | 20 | 4,967(0.40%)#29 | 1,408,349(0.00%)#2,663 |
| 30. | Coralville | 18 | 4,967(0.36%)#30 | 1,408,349(0.00%)#2,746 |
| 31. | Sheldon | 18 | 4,967(0.36%)#31 | 1,408,349(0.00%)#2,756 |
| 32. | Lenox | 16 | 4,967(0.32%)#32 | 1,408,349(0.00%)#2,848 |
| 33. | Kiron | 16 | 4,967(0.32%)#33 | 1,408,349(0.00%)#2,851 |
| 34. | Fairfield | 15 | 4,967(0.30%)#34 | 1,408,349(0.00%)#2,889 |
| 35. | Ankeny | 14 | 4,967(0.28%)#35 | 1,408,349(0.00%)#2,928 |
| 36. | Postville | 13 | 4,967(0.26%)#36 | 1,408,349(0.00%)#3,032 |
| 37. | Pleasant Hill | 12 | 4,967(0.24%)#37 | 1,408,349(0.00%)#3,078 |
| 38. | Oakland | 11 | 4,967(0.22%)#38 | 1,408,349(0.00%)#3,154 |
| 39. | Slater | 11 | 4,967(0.22%)#39 | 1,408,349(0.00%)#3,155 |
| 40. | Lester | 11 | 4,967(0.22%)#40 | 1,408,349(0.00%)#3,166 |
| 41. | Cedar Falls | 9 | 4,967(0.18%)#41 | 1,408,349(0.00%)#3,238 |
| 42. | Dyersville | 9 | 4,967(0.18%)#42 | 1,408,349(0.00%)#3,279 |
| 43. | Latimer | 9 | 4,967(0.18%)#43 | 1,408,349(0.00%)#3,305 |
| 44. | Algona | 8 | 4,967(0.16%)#44 | 1,408,349(0.00%)#3,363 |
| 45. | Redfield | 7 | 4,967(0.14%)#45 | 1,408,349(0.00%)#3,468 |
| 46. | Swisher | 5 | 4,967(0.10%)#46 | 1,408,349(0.00%)#3,617 |
| 47. | Ainsworth | 5 | 4,967(0.10%)#47 | 1,408,349(0.00%)#3,621 |
| 48. | University Park | 5 | 4,967(0.10%)#48 | 1,408,349(0.00%)#3,629 |
| 49. | Fort Dodge | 4 | 4,967(0.08%)#49 | 1,408,349(0.00%)#3,643 |
| 50. | Harlan | 4 | 4,967(0.08%)#50 | 1,408,349(0.00%)#3,657 |
| 51. | Columbus Junction | 4 | 4,967(0.08%)#51 | 1,408,349(0.00%)#3,678 |
| 52. | Readlyn | 4 | 4,967(0.08%)#52 | 1,408,349(0.00%)#3,703 |
| 53. | Palmer | 3 | 4,967(0.06%)#53 | 1,408,349(0.00%)#3,782 |
| 54. | Woodbine | 2 | 4,967(0.04%)#54 | 1,408,349(0.00%)#3,818 |
| 55. | Lakeside | 2 | 4,967(0.04%)#55 | 1,408,349(0.00%)#3,834 |
| 56. | Elkhart | 2 | 4,967(0.04%)#56 | 1,408,349(0.00%)#3,837 |
| 57. | Emerson | 2 | 4,967(0.04%)#57 | 1,408,349(0.00%)#3,841 |
| 58. | Dawson | 1 | 4,967(0.02%)#58 | 1,408,349(0.00%)#3,925 |
Common Questions
What are the Top 10 Cities with the Most Immigrants from El Salvador in Iowa?
Top 10 Cities with the Most Immigrants from El Salvador in Iowa are:
#1
1,698
#2
410
#3
403
#4
393
#5
219
#6
198
#7
187
#8
180
#9
139
#10
93
What city has the Most Immigrants from El Salvador in Iowa?
Des Moines has the Most Immigrants from El Salvador in Iowa with 1,698.
What is the Total Immigrants from El Salvador in the State of Iowa?
Total Immigrants from El Salvador in Iowa is 4,967.
What is the Total Immigrants from El Salvador in the United States?
Total Immigrants from El Salvador in the United States is 1,408,349.