Cities with the Most Immigrants from El Salvador in Missouri
RELATED REPORTS & OPTIONS
El Salvador
Missouri
Compare Cities
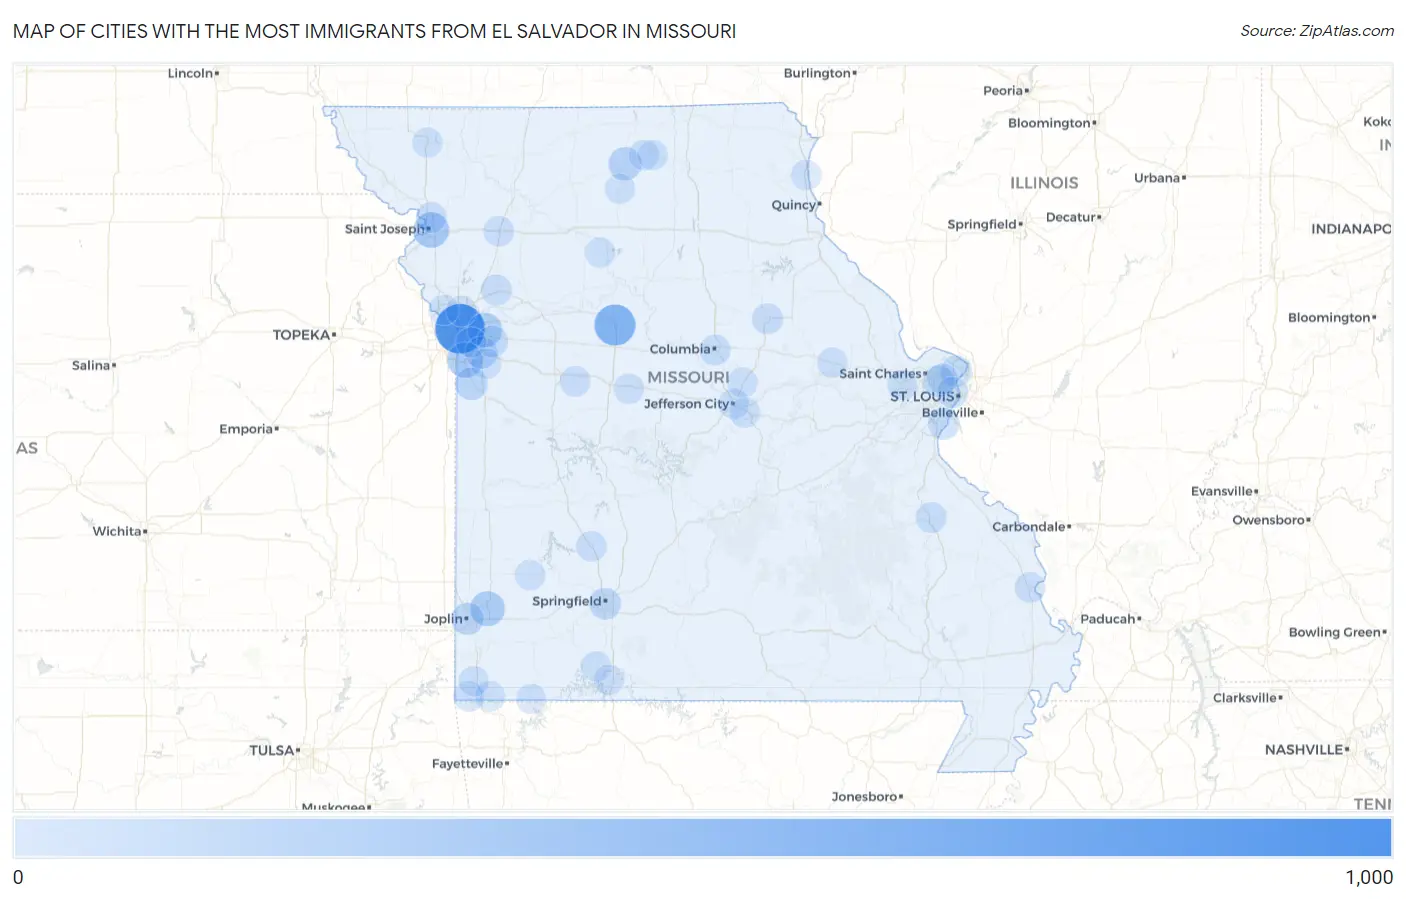
Map of Cities with the Most Immigrants from El Salvador in Missouri
0
1,000
Cities with the Most Immigrants from El Salvador in Missouri
| City | El Salvador | vs State | vs National | |
| 1. | Kansas City | 965 | 3,926(24.58%)#1 | 1,408,349(0.07%)#234 |
| 2. | Marshall | 533 | 3,926(13.58%)#2 | 1,408,349(0.04%)#389 |
| 3. | St Joseph | 261 | 3,926(6.65%)#3 | 1,408,349(0.02%)#715 |
| 4. | Grandview | 260 | 3,926(6.62%)#4 | 1,408,349(0.02%)#718 |
| 5. | Carthage | 226 | 3,926(5.76%)#5 | 1,408,349(0.02%)#791 |
| 6. | Independence | 205 | 3,926(5.22%)#6 | 1,408,349(0.01%)#833 |
| 7. | Milan | 147 | 3,926(3.74%)#7 | 1,408,349(0.01%)#1,050 |
| 8. | Peculiar | 118 | 3,926(3.01%)#8 | 1,408,349(0.01%)#1,193 |
| 9. | Lee S Summit | 101 | 3,926(2.57%)#9 | 1,408,349(0.01%)#1,292 |
| 10. | Joplin | 96 | 3,926(2.45%)#10 | 1,408,349(0.01%)#1,328 |
| 11. | Springfield | 75 | 3,926(1.91%)#11 | 1,408,349(0.01%)#1,515 |
| 12. | Spanish Lake | 64 | 3,926(1.63%)#12 | 1,408,349(0.00%)#1,669 |
| 13. | Oakville | 61 | 3,926(1.55%)#13 | 1,408,349(0.00%)#1,707 |
| 14. | Woodson Terrace | 54 | 3,926(1.38%)#14 | 1,408,349(0.00%)#1,828 |
| 15. | Blue Springs | 52 | 3,926(1.32%)#15 | 1,408,349(0.00%)#1,845 |
| 16. | St Louis | 43 | 3,926(1.10%)#16 | 1,408,349(0.00%)#1,999 |
| 17. | Excelsior Springs | 38 | 3,926(0.97%)#17 | 1,408,349(0.00%)#2,114 |
| 18. | Mexico | 37 | 3,926(0.94%)#18 | 1,408,349(0.00%)#2,142 |
| 19. | Columbia | 35 | 3,926(0.89%)#19 | 1,408,349(0.00%)#2,179 |
| 20. | Farmington | 25 | 3,926(0.64%)#20 | 1,408,349(0.00%)#2,447 |
| 21. | Bolivar | 24 | 3,926(0.61%)#21 | 1,408,349(0.00%)#2,487 |
| 22. | Berkeley | 20 | 3,926(0.51%)#22 | 1,408,349(0.00%)#2,661 |
| 23. | Whiteman Afb | 20 | 3,926(0.51%)#23 | 1,408,349(0.00%)#2,674 |
| 24. | Country Club | 20 | 3,926(0.51%)#24 | 1,408,349(0.00%)#2,678 |
| 25. | Jefferson City | 15 | 3,926(0.38%)#25 | 1,408,349(0.00%)#2,857 |
| 26. | Cape Girardeau | 15 | 3,926(0.38%)#26 | 1,408,349(0.00%)#2,858 |
| 27. | Cameron | 13 | 3,926(0.33%)#27 | 1,408,349(0.00%)#3,014 |
| 28. | Raytown | 10 | 3,926(0.25%)#28 | 1,408,349(0.00%)#3,176 |
| 29. | Noel | 9 | 3,926(0.23%)#29 | 1,408,349(0.00%)#3,289 |
| 30. | Greenwood | 8 | 3,926(0.20%)#30 | 1,408,349(0.00%)#3,359 |
| 31. | Canton | 8 | 3,926(0.20%)#31 | 1,408,349(0.00%)#3,373 |
| 32. | Green City | 8 | 3,926(0.20%)#32 | 1,408,349(0.00%)#3,396 |
| 33. | Jane | 8 | 3,926(0.20%)#33 | 1,408,349(0.00%)#3,398 |
| 34. | Gladstone | 7 | 3,926(0.18%)#34 | 1,408,349(0.00%)#3,415 |
| 35. | Lockwood | 7 | 3,926(0.18%)#35 | 1,408,349(0.00%)#3,463 |
| 36. | Reeds Spring | 7 | 3,926(0.18%)#36 | 1,408,349(0.00%)#3,466 |
| 37. | Greencastle | 7 | 3,926(0.18%)#37 | 1,408,349(0.00%)#3,476 |
| 38. | Anderson | 6 | 3,926(0.15%)#38 | 1,408,349(0.00%)#3,528 |
| 39. | New Bloomfield | 6 | 3,926(0.15%)#39 | 1,408,349(0.00%)#3,556 |
| 40. | Parkville | 5 | 3,926(0.13%)#40 | 1,408,349(0.00%)#3,581 |
| 41. | Jonesburg | 5 | 3,926(0.13%)#41 | 1,408,349(0.00%)#3,624 |
| 42. | Maryville | 4 | 3,926(0.10%)#42 | 1,408,349(0.00%)#3,653 |
| 43. | Browning | 4 | 3,926(0.10%)#43 | 1,408,349(0.00%)#3,714 |
| 44. | Branson | 3 | 3,926(0.08%)#44 | 1,408,349(0.00%)#3,727 |
| 45. | Taos | 3 | 3,926(0.08%)#45 | 1,408,349(0.00%)#3,757 |
| 46. | Hale | 3 | 3,926(0.08%)#46 | 1,408,349(0.00%)#3,773 |
| 47. | Seligman | 2 | 3,926(0.05%)#47 | 1,408,349(0.00%)#3,829 |
| 48. | Smithton | 2 | 3,926(0.05%)#48 | 1,408,349(0.00%)#3,839 |
| 49. | Weldon Spring Heights | 2 | 3,926(0.05%)#49 | 1,408,349(0.00%)#3,859 |
Common Questions
What are the Top 10 Cities with the Most Immigrants from El Salvador in Missouri?
Top 10 Cities with the Most Immigrants from El Salvador in Missouri are:
#1
965
#2
533
#3
261
#4
260
#5
226
#6
205
#7
147
#8
118
#9
101
#10
96
What city has the Most Immigrants from El Salvador in Missouri?
Kansas City has the Most Immigrants from El Salvador in Missouri with 965.
What is the Total Immigrants from El Salvador in the State of Missouri?
Total Immigrants from El Salvador in Missouri is 3,926.
What is the Total Immigrants from El Salvador in the United States?
Total Immigrants from El Salvador in the United States is 1,408,349.