Cities with the Most Immigrants from El Salvador in Georgia
RELATED REPORTS & OPTIONS
El Salvador
Georgia
Compare Cities
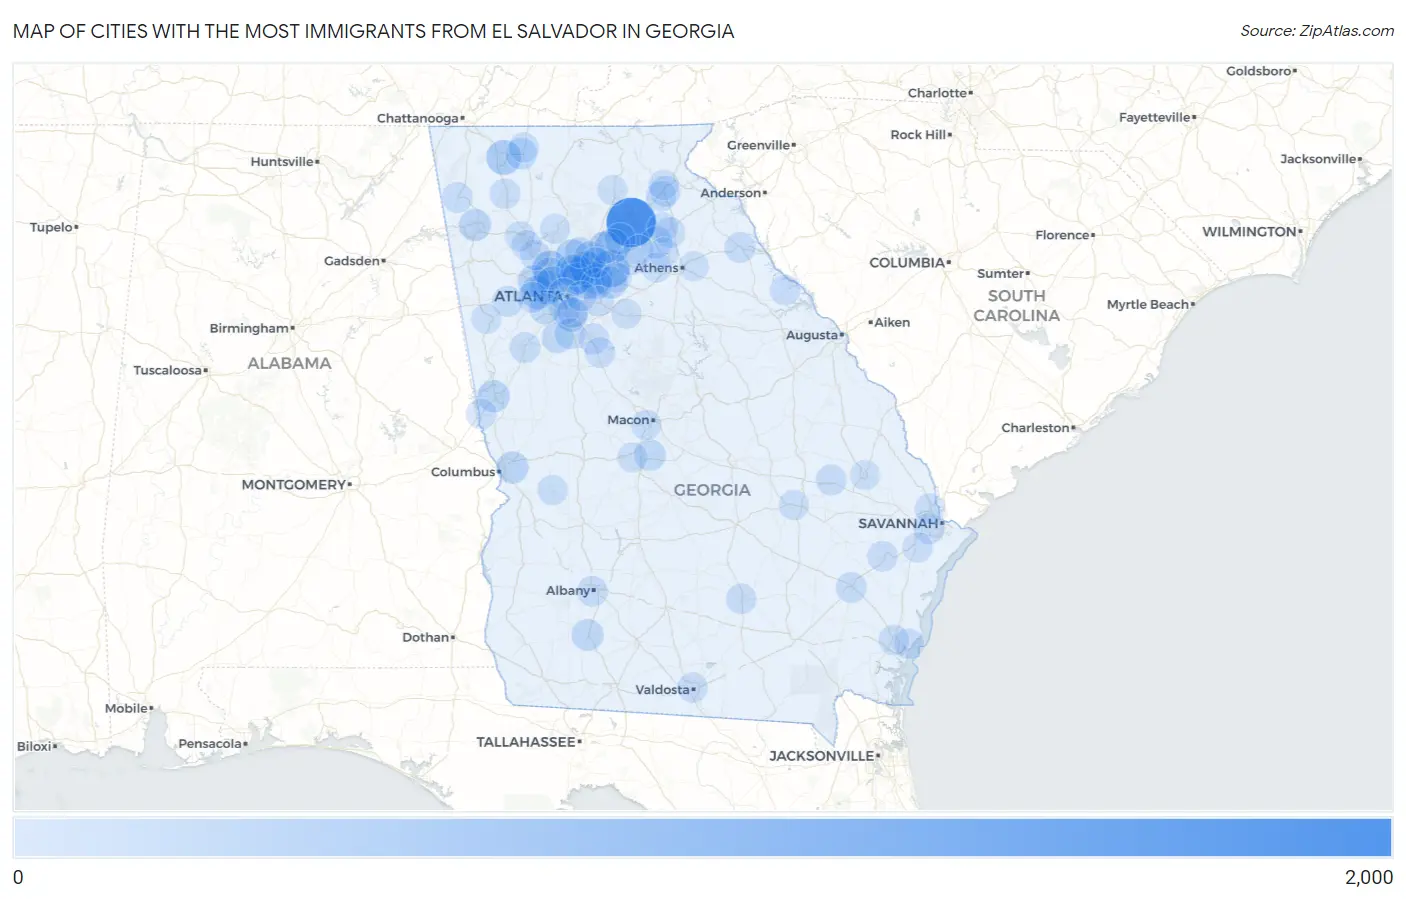
Map of Cities with the Most Immigrants from El Salvador in Georgia
0
2,000
Cities with the Most Immigrants from El Salvador in Georgia
| City | El Salvador | vs State | vs National | |
| 1. | Gainesville | 1,614 | 27,794(5.81%)#1 | 1,408,349(0.11%)#139 |
| 2. | Athens-Clarke County Unified Government (Balance) | 627 | 27,794(2.26%)#2 | 1,408,349(0.04%)#325 |
| 3. | Lawrenceville | 565 | 27,794(2.03%)#3 | 1,408,349(0.04%)#363 |
| 4. | Marietta | 465 | 27,794(1.67%)#4 | 1,408,349(0.03%)#428 |
| 5. | Norcross | 391 | 27,794(1.41%)#5 | 1,408,349(0.03%)#505 |
| 6. | Doraville | 390 | 27,794(1.40%)#6 | 1,408,349(0.03%)#507 |
| 7. | Dalton | 381 | 27,794(1.37%)#7 | 1,408,349(0.03%)#519 |
| 8. | Buford | 349 | 27,794(1.26%)#8 | 1,408,349(0.02%)#562 |
| 9. | Mableton | 316 | 27,794(1.14%)#9 | 1,408,349(0.02%)#622 |
| 10. | Roswell | 287 | 27,794(1.03%)#10 | 1,408,349(0.02%)#668 |
| 11. | Lithia Springs | 270 | 27,794(0.97%)#11 | 1,408,349(0.02%)#701 |
| 12. | Tucker | 249 | 27,794(0.90%)#12 | 1,408,349(0.02%)#740 |
| 13. | Lilburn | 245 | 27,794(0.88%)#13 | 1,408,349(0.02%)#747 |
| 14. | Forest Park | 237 | 27,794(0.85%)#14 | 1,408,349(0.02%)#767 |
| 15. | Peachtree Corners | 234 | 27,794(0.84%)#15 | 1,408,349(0.02%)#777 |
| 16. | Johns Creek | 196 | 27,794(0.71%)#16 | 1,408,349(0.01%)#858 |
| 17. | Fair Oaks | 194 | 27,794(0.70%)#17 | 1,408,349(0.01%)#865 |
| 18. | Sugar Hill | 190 | 27,794(0.68%)#18 | 1,408,349(0.01%)#873 |
| 19. | Powder Springs | 163 | 27,794(0.59%)#19 | 1,408,349(0.01%)#979 |
| 20. | Rome | 161 | 27,794(0.58%)#20 | 1,408,349(0.01%)#985 |
| 21. | Columbus | 160 | 27,794(0.58%)#21 | 1,408,349(0.01%)#987 |
| 22. | Snellville | 159 | 27,794(0.57%)#22 | 1,408,349(0.01%)#993 |
| 23. | Lagrange | 152 | 27,794(0.55%)#23 | 1,408,349(0.01%)#1,024 |
| 24. | Smyrna | 146 | 27,794(0.53%)#24 | 1,408,349(0.01%)#1,051 |
| 25. | Jefferson | 146 | 27,794(0.53%)#25 | 1,408,349(0.01%)#1,054 |
| 26. | Camilla | 138 | 27,794(0.50%)#26 | 1,408,349(0.01%)#1,086 |
| 27. | Brookhaven | 132 | 27,794(0.47%)#27 | 1,408,349(0.01%)#1,109 |
| 28. | Chamblee | 122 | 27,794(0.44%)#28 | 1,408,349(0.01%)#1,160 |
| 29. | Warner Robins | 114 | 27,794(0.41%)#29 | 1,408,349(0.01%)#1,213 |
| 30. | Dunwoody | 114 | 27,794(0.41%)#30 | 1,408,349(0.01%)#1,216 |
| 31. | Sandy Springs | 111 | 27,794(0.40%)#31 | 1,408,349(0.01%)#1,228 |
| 32. | Chatsworth | 109 | 27,794(0.39%)#32 | 1,408,349(0.01%)#1,243 |
| 33. | Fayetteville | 98 | 27,794(0.35%)#33 | 1,408,349(0.01%)#1,316 |
| 34. | Flowery Branch | 87 | 27,794(0.31%)#34 | 1,408,349(0.01%)#1,415 |
| 35. | Mountain Park | 83 | 27,794(0.30%)#35 | 1,408,349(0.01%)#1,449 |
| 36. | Atlanta | 82 | 27,794(0.30%)#36 | 1,408,349(0.01%)#1,452 |
| 37. | Hapeville | 82 | 27,794(0.30%)#37 | 1,408,349(0.01%)#1,459 |
| 38. | South Fulton | 73 | 27,794(0.26%)#38 | 1,408,349(0.01%)#1,538 |
| 39. | Alpharetta | 60 | 27,794(0.22%)#39 | 1,408,349(0.00%)#1,722 |
| 40. | Newnan | 59 | 27,794(0.21%)#40 | 1,408,349(0.00%)#1,737 |
| 41. | Cornelia | 59 | 27,794(0.21%)#41 | 1,408,349(0.00%)#1,743 |
| 42. | Savannah | 58 | 27,794(0.21%)#42 | 1,408,349(0.00%)#1,748 |
| 43. | Jesup | 58 | 27,794(0.21%)#43 | 1,408,349(0.00%)#1,756 |
| 44. | Metter | 57 | 27,794(0.21%)#44 | 1,408,349(0.00%)#1,775 |
| 45. | Villa Rica | 56 | 27,794(0.20%)#45 | 1,408,349(0.00%)#1,785 |
| 46. | Douglasville | 51 | 27,794(0.18%)#46 | 1,408,349(0.00%)#1,867 |
| 47. | Elberton | 51 | 27,794(0.18%)#47 | 1,408,349(0.00%)#1,876 |
| 48. | Irondale | 50 | 27,794(0.18%)#48 | 1,408,349(0.00%)#1,892 |
| 49. | Albany | 49 | 27,794(0.18%)#49 | 1,408,349(0.00%)#1,899 |
| 50. | Summerville | 47 | 27,794(0.17%)#50 | 1,408,349(0.00%)#1,935 |
| 51. | Augusta-Richmond County Consolidated Government (Balance) | 46 | 27,794(0.17%)#51 | 1,408,349(0.00%)#1,938 |
| 52. | Baldwin | 42 | 27,794(0.15%)#52 | 1,408,349(0.00%)#2,032 |
| 53. | Commerce | 40 | 27,794(0.14%)#53 | 1,408,349(0.00%)#2,076 |
| 54. | Mcdonough | 39 | 27,794(0.14%)#54 | 1,408,349(0.00%)#2,090 |
| 55. | Port Wentworth | 39 | 27,794(0.14%)#55 | 1,408,349(0.00%)#2,095 |
| 56. | Locust Grove | 39 | 27,794(0.14%)#56 | 1,408,349(0.00%)#2,097 |
| 57. | Conley | 37 | 27,794(0.13%)#57 | 1,408,349(0.00%)#2,148 |
| 58. | Hinesville | 29 | 27,794(0.10%)#58 | 1,408,349(0.00%)#2,326 |
| 59. | Lithonia | 29 | 27,794(0.10%)#59 | 1,408,349(0.00%)#2,352 |
| 60. | Maysville | 27 | 27,794(0.10%)#60 | 1,408,349(0.00%)#2,399 |
| 61. | Calhoun | 26 | 27,794(0.09%)#61 | 1,408,349(0.00%)#2,409 |
| 62. | St Simons | 26 | 27,794(0.09%)#62 | 1,408,349(0.00%)#2,412 |
| 63. | Douglas | 26 | 27,794(0.09%)#63 | 1,408,349(0.00%)#2,415 |
| 64. | Duluth | 24 | 27,794(0.09%)#64 | 1,408,349(0.00%)#2,474 |
| 65. | Auburn | 24 | 27,794(0.09%)#65 | 1,408,349(0.00%)#2,491 |
| 66. | Lincolnton | 22 | 27,794(0.08%)#66 | 1,408,349(0.00%)#2,588 |
| 67. | Macon Bibb County | 21 | 27,794(0.08%)#67 | 1,408,349(0.00%)#2,597 |
| 68. | West Point | 20 | 27,794(0.07%)#68 | 1,408,349(0.00%)#2,676 |
| 69. | Jekyll Island | 19 | 27,794(0.07%)#69 | 1,408,349(0.00%)#2,727 |
| 70. | Valdosta | 18 | 27,794(0.06%)#70 | 1,408,349(0.00%)#2,731 |
| 71. | Acworth | 17 | 27,794(0.06%)#71 | 1,408,349(0.00%)#2,780 |
| 72. | Dock Junction | 16 | 27,794(0.06%)#72 | 1,408,349(0.00%)#2,832 |
| 73. | Echols County Consolidated Government | 15 | 27,794(0.05%)#73 | 1,408,349(0.00%)#2,908 |
| 74. | Buena Vista | 14 | 27,794(0.05%)#74 | 1,408,349(0.00%)#2,966 |
| 75. | Vidalia | 13 | 27,794(0.05%)#75 | 1,408,349(0.00%)#3,008 |
| 76. | Cusseta Chattahoochee County Unified Government | 13 | 27,794(0.05%)#76 | 1,408,349(0.00%)#3,013 |
| 77. | Carrollton | 9 | 27,794(0.03%)#77 | 1,408,349(0.00%)#3,245 |
| 78. | Cartersville | 9 | 27,794(0.03%)#78 | 1,408,349(0.00%)#3,249 |
| 79. | Statesboro | 8 | 27,794(0.03%)#79 | 1,408,349(0.00%)#3,324 |
| 80. | Grayson | 8 | 27,794(0.03%)#80 | 1,408,349(0.00%)#3,367 |
| 81. | Winterville | 8 | 27,794(0.03%)#81 | 1,408,349(0.00%)#3,380 |
| 82. | Arcade | 8 | 27,794(0.03%)#82 | 1,408,349(0.00%)#3,383 |
| 83. | Belvedere Park | 6 | 27,794(0.02%)#83 | 1,408,349(0.00%)#3,500 |
| 84. | Hoschton | 6 | 27,794(0.02%)#84 | 1,408,349(0.00%)#3,521 |
| 85. | Demorest | 6 | 27,794(0.02%)#85 | 1,408,349(0.00%)#3,530 |
| 86. | Richmond Hill | 5 | 27,794(0.02%)#86 | 1,408,349(0.00%)#3,578 |
| 87. | Dahlonega | 5 | 27,794(0.02%)#87 | 1,408,349(0.00%)#3,583 |
| 88. | Statham | 5 | 27,794(0.02%)#88 | 1,408,349(0.00%)#3,599 |
| 89. | Eton | 5 | 27,794(0.02%)#89 | 1,408,349(0.00%)#3,613 |
| 90. | Fort Valley | 4 | 27,794(0.01%)#90 | 1,408,349(0.00%)#3,654 |
| 91. | Emerson | 4 | 27,794(0.01%)#91 | 1,408,349(0.00%)#3,685 |
| 92. | Oxford | 3 | 27,794(0.01%)#92 | 1,408,349(0.00%)#3,746 |
| 93. | Canton | 1 | 27,794(0.00%)#93 | 1,408,349(0.00%)#3,866 |
Common Questions
What are the Top 10 Cities with the Most Immigrants from El Salvador in Georgia?
Top 10 Cities with the Most Immigrants from El Salvador in Georgia are:
#1
1,614
#2
565
#3
465
#4
391
#5
390
#6
381
#7
349
#8
316
#9
287
#10
270
What city has the Most Immigrants from El Salvador in Georgia?
Gainesville has the Most Immigrants from El Salvador in Georgia with 1,614.
What is the Total Immigrants from El Salvador in the State of Georgia?
Total Immigrants from El Salvador in Georgia is 27,794.
What is the Total Immigrants from El Salvador in the United States?
Total Immigrants from El Salvador in the United States is 1,408,349.