Cities with the Most Immigrants from El Salvador in Kentucky
RELATED REPORTS & OPTIONS
El Salvador
Kentucky
Compare Cities
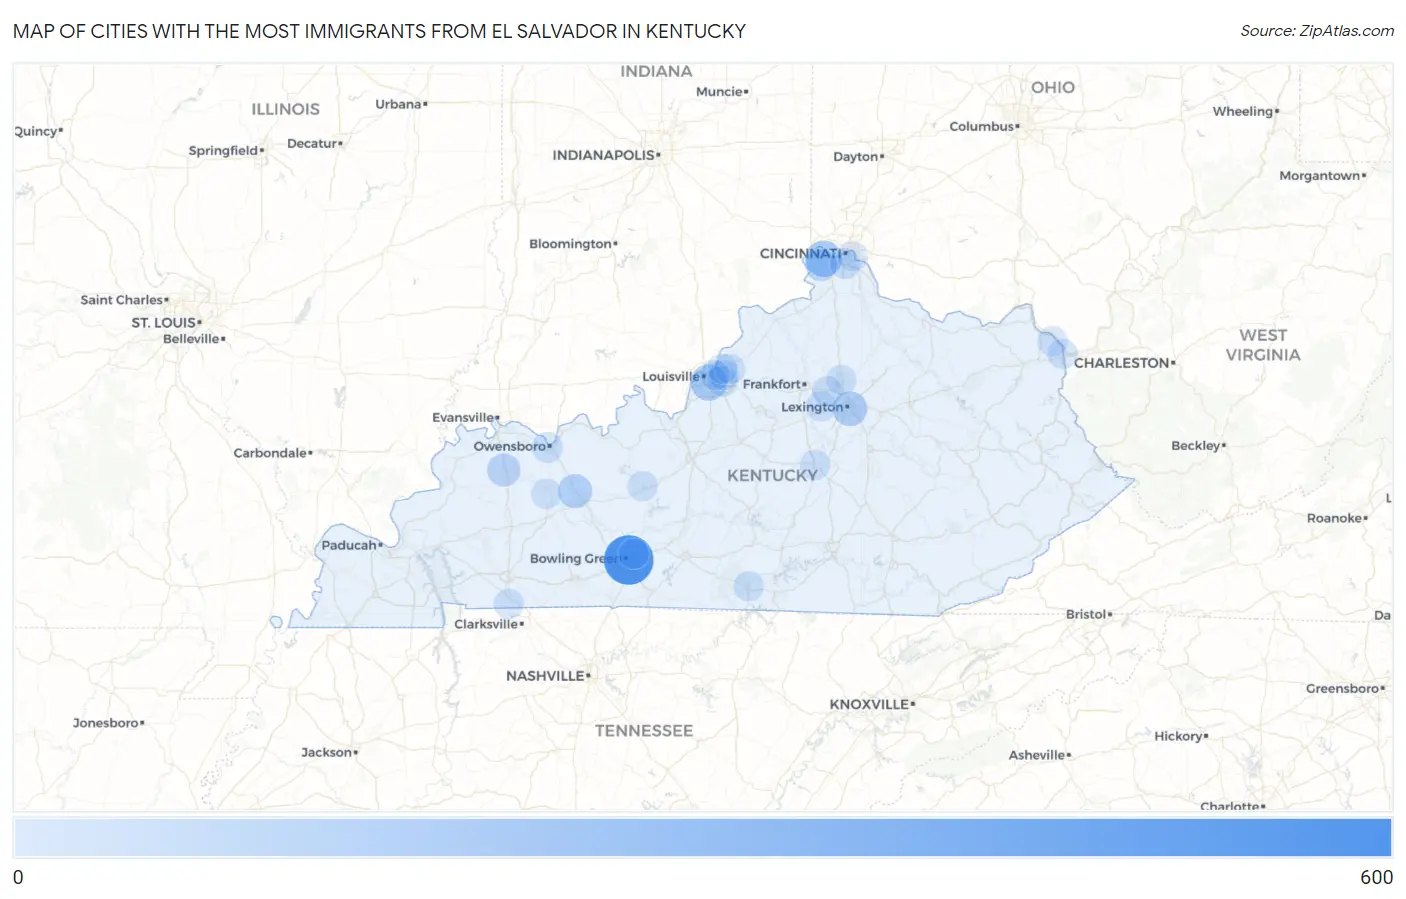
Map of Cities with the Most Immigrants from El Salvador in Kentucky
0
600
Cities with the Most Immigrants from El Salvador in Kentucky
| City | El Salvador | vs State | vs National | |
| 1. | Bowling Green | 567 | 1,652(34.32%)#1 | 1,408,349(0.04%)#361 |
| 2. | Hebron | 175 | 1,652(10.59%)#2 | 1,408,349(0.01%)#931 |
| 3. | Louisville | 173 | 1,652(10.47%)#3 | 1,408,349(0.01%)#934 |
| 4. | Lexington | 129 | 1,652(7.81%)#4 | 1,408,349(0.01%)#1,127 |
| 5. | Hartford | 112 | 1,652(6.78%)#5 | 1,408,349(0.01%)#1,227 |
| 6. | Sebree | 84 | 1,652(5.08%)#6 | 1,408,349(0.01%)#1,443 |
| 7. | Burlington | 55 | 1,652(3.33%)#7 | 1,408,349(0.00%)#1,806 |
| 8. | Owensboro | 22 | 1,652(1.33%)#8 | 1,408,349(0.00%)#2,554 |
| 9. | Hurstbourne Acres | 22 | 1,652(1.33%)#9 | 1,408,349(0.00%)#2,586 |
| 10. | Covington | 17 | 1,652(1.03%)#10 | 1,408,349(0.00%)#2,773 |
| 11. | Versailles | 13 | 1,652(0.79%)#11 | 1,408,349(0.00%)#3,010 |
| 12. | Midway | 13 | 1,652(0.79%)#12 | 1,408,349(0.00%)#3,038 |
| 13. | Danville | 12 | 1,652(0.73%)#13 | 1,408,349(0.00%)#3,064 |
| 14. | Fort Campbell North | 9 | 1,652(0.54%)#14 | 1,408,349(0.00%)#3,258 |
| 15. | Lyndon | 9 | 1,652(0.54%)#15 | 1,408,349(0.00%)#3,260 |
| 16. | Bellefonte | 9 | 1,652(0.54%)#16 | 1,408,349(0.00%)#3,299 |
| 17. | Plum Springs | 9 | 1,652(0.54%)#17 | 1,408,349(0.00%)#3,311 |
| 18. | Leitchfield | 7 | 1,652(0.42%)#18 | 1,408,349(0.00%)#3,441 |
| 19. | Burkesville | 6 | 1,652(0.36%)#19 | 1,408,349(0.00%)#3,546 |
| 20. | Georgetown | 5 | 1,652(0.30%)#20 | 1,408,349(0.00%)#3,567 |
| 21. | Catlettsburg | 5 | 1,652(0.30%)#21 | 1,408,349(0.00%)#3,611 |
| 22. | Worthington Hills | 4 | 1,652(0.24%)#22 | 1,408,349(0.00%)#3,677 |
| 23. | Island | 3 | 1,652(0.18%)#23 | 1,408,349(0.00%)#3,770 |
| 24. | Fort Thomas | 1 | 1,652(0.06%)#24 | 1,408,349(0.00%)#3,870 |
| 25. | Brownsboro Farm | 1 | 1,652(0.06%)#25 | 1,408,349(0.00%)#3,914 |
| 26. | Bellewood | 1 | 1,652(0.06%)#26 | 1,408,349(0.00%)#3,921 |
Common Questions
What are the Top 10 Cities with the Most Immigrants from El Salvador in Kentucky?
Top 10 Cities with the Most Immigrants from El Salvador in Kentucky are:
#1
567
#2
175
#3
173
#4
129
#5
112
#6
84
#7
55
#8
22
#9
22
#10
17
What city has the Most Immigrants from El Salvador in Kentucky?
Bowling Green has the Most Immigrants from El Salvador in Kentucky with 567.
What is the Total Immigrants from El Salvador in the State of Kentucky?
Total Immigrants from El Salvador in Kentucky is 1,652.
What is the Total Immigrants from El Salvador in the United States?
Total Immigrants from El Salvador in the United States is 1,408,349.