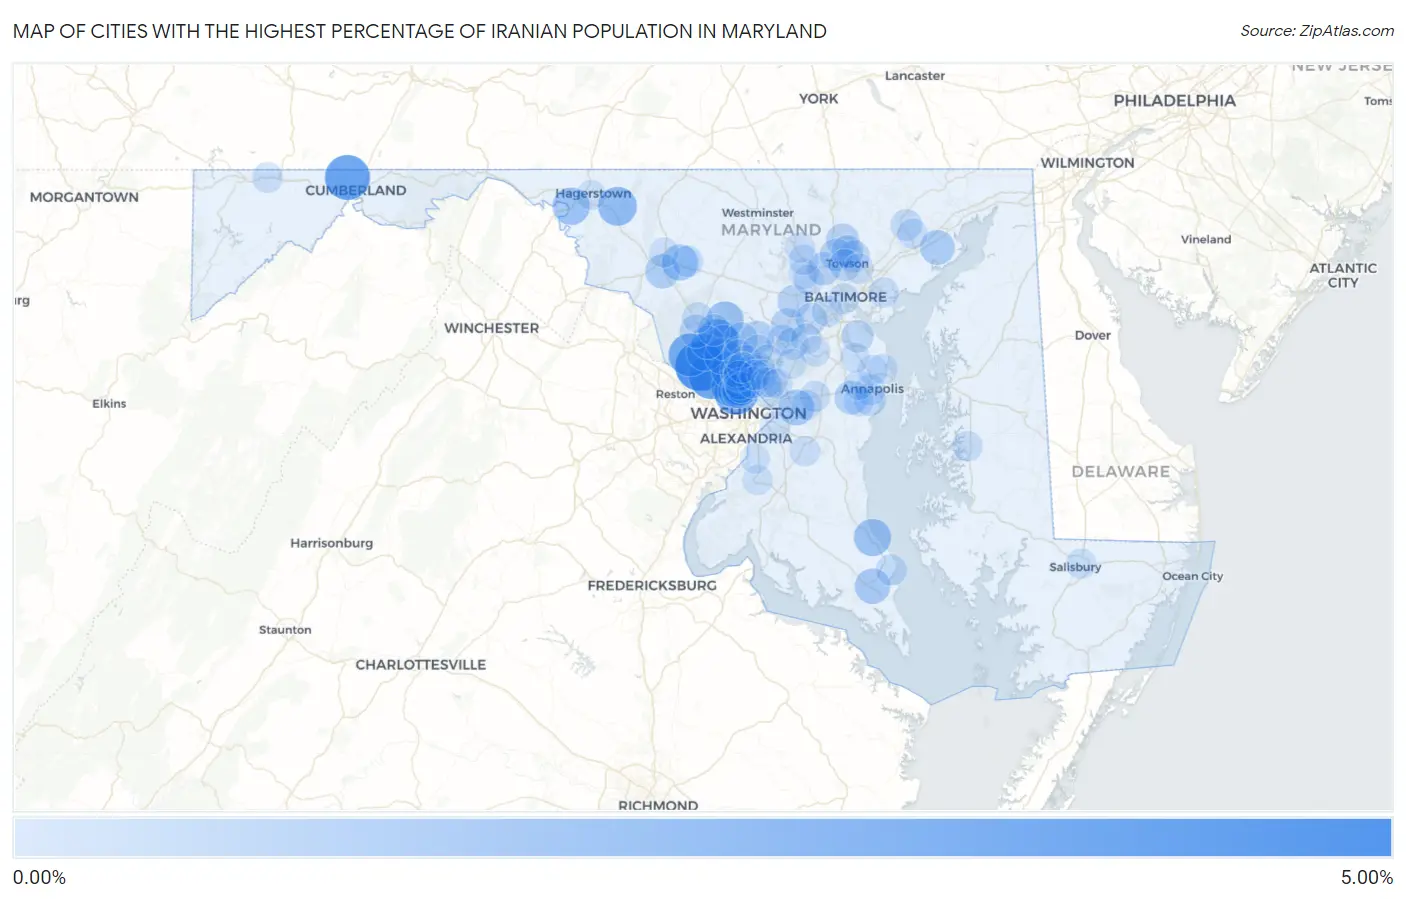
Cities with the Highest Percentage of Iranian Population in Maryland
RELATED REPORTS & OPTIONS
Iranian
Maryland
Compare Cities
Map of Cities with the Highest Percentage of Iranian Population in Maryland
0.00%
5.00%
Cities with the Highest Percentage of Iranian Population in Maryland
| City | Iranian | vs State | vs National | |
| 1. | Travilah | 4.55% | 0.27%(+4.27)#1 | 0.15%(+4.40)#42 |
| 2. | Potomac | 3.53% | 0.27%(+3.26)#2 | 0.15%(+3.38)#64 |
| 3. | Corriganville | 3.49% | 0.27%(+3.22)#3 | 0.15%(+3.34)#66 |
| 4. | Friendship Heights Village | 3.27% | 0.27%(+3.00)#4 | 0.15%(+3.12)#72 |
| 5. | Darnestown | 2.95% | 0.27%(+2.68)#5 | 0.15%(+2.81)#81 |
| 6. | Washington Grove | 2.65% | 0.27%(+2.38)#6 | 0.15%(+2.50)#98 |
| 7. | Chevy Chase Section Five | 2.14% | 0.27%(+1.86)#7 | 0.15%(+1.99)#135 |
| 8. | Mount Aetna | 2.03% | 0.27%(+1.76)#8 | 0.15%(+1.88)#140 |
| 9. | Bethesda | 1.76% | 0.27%(+1.49)#9 | 0.15%(+1.61)#169 |
| 10. | North Bethesda | 1.71% | 0.27%(+1.44)#10 | 0.15%(+1.57)#181 |
| 11. | Williamsport | 1.67% | 0.27%(+1.40)#11 | 0.15%(+1.52)#188 |
| 12. | St Leonard | 1.65% | 0.27%(+1.38)#12 | 0.15%(+1.51)#193 |
| 13. | Laytonsville | 1.63% | 0.27%(+1.36)#13 | 0.15%(+1.48)#198 |
| 14. | North Potomac | 1.59% | 0.27%(+1.32)#14 | 0.15%(+1.44)#212 |
| 15. | Rockville | 1.43% | 0.27%(+1.16)#15 | 0.15%(+1.28)#244 |
| 16. | Spring Ridge | 1.39% | 0.27%(+1.12)#16 | 0.15%(+1.24)#253 |
| 17. | Chevy Chase Section Three | 1.36% | 0.27%(+1.09)#17 | 0.15%(+1.22)#263 |
| 18. | Lake Arbor | 1.35% | 0.27%(+1.08)#18 | 0.15%(+1.20)#269 |
| 19. | California | 1.24% | 0.27%(+0.968)#19 | 0.15%(+1.09)#298 |
| 20. | Redland | 1.22% | 0.27%(+0.950)#20 | 0.15%(+1.07)#302 |
| 21. | Perryman | 1.08% | 0.27%(+0.811)#21 | 0.15%(+0.935)#361 |
| 22. | Ballenger Creek | 1.06% | 0.27%(+0.789)#22 | 0.15%(+0.913)#370 |
| 23. | South Kensington | 0.97% | 0.27%(+0.696)#23 | 0.15%(+0.820)#403 |
| 24. | Riva | 0.88% | 0.27%(+0.607)#24 | 0.15%(+0.731)#439 |
| 25. | Somerset | 0.88% | 0.27%(+0.604)#25 | 0.15%(+0.728)#440 |
| 26. | Chevy Chase Village | 0.85% | 0.27%(+0.578)#26 | 0.15%(+0.702)#454 |
| 27. | Ashton Sandy Spring | 0.79% | 0.27%(+0.518)#27 | 0.15%(+0.642)#472 |
| 28. | Gaithersburg | 0.76% | 0.27%(+0.492)#28 | 0.15%(+0.616)#491 |
| 29. | Columbia | 0.76% | 0.27%(+0.487)#29 | 0.15%(+0.611)#497 |
| 30. | Germantown | 0.76% | 0.27%(+0.485)#30 | 0.15%(+0.609)#499 |
| 31. | Pikesville | 0.74% | 0.27%(+0.468)#31 | 0.15%(+0.592)#510 |
| 32. | Olney | 0.73% | 0.27%(+0.458)#32 | 0.15%(+0.582)#517 |
| 33. | Woodlawn Cdp Baltimore County | 0.71% | 0.27%(+0.439)#33 | 0.15%(+0.563)#531 |
| 34. | Cockeysville | 0.71% | 0.27%(+0.434)#34 | 0.15%(+0.558)#536 |
| 35. | Mays Chapel | 0.67% | 0.27%(+0.401)#35 | 0.15%(+0.525)#567 |
| 36. | Ellicott City | 0.64% | 0.27%(+0.372)#36 | 0.15%(+0.496)#588 |
| 37. | Kensington | 0.58% | 0.27%(+0.309)#37 | 0.15%(+0.433)#666 |
| 38. | North Kensington | 0.57% | 0.27%(+0.295)#38 | 0.15%(+0.419)#678 |
| 39. | Pasadena | 0.53% | 0.27%(+0.261)#39 | 0.15%(+0.385)#717 |
| 40. | Hampton | 0.53% | 0.27%(+0.260)#40 | 0.15%(+0.384)#719 |
| 41. | Glenmont | 0.51% | 0.27%(+0.240)#41 | 0.15%(+0.364)#744 |
| 42. | Timonium | 0.50% | 0.27%(+0.229)#42 | 0.15%(+0.353)#760 |
| 43. | Flower Hill | 0.50% | 0.27%(+0.228)#43 | 0.15%(+0.352)#761 |
| 44. | Garrett Park | 0.49% | 0.27%(+0.219)#44 | 0.15%(+0.343)#774 |
| 45. | Kemp Mill | 0.48% | 0.27%(+0.211)#45 | 0.15%(+0.335)#786 |
| 46. | Towson | 0.45% | 0.27%(+0.182)#46 | 0.15%(+0.306)#823 |
| 47. | North Laurel | 0.45% | 0.27%(+0.179)#47 | 0.15%(+0.303)#830 |
| 48. | Montgomery Village | 0.45% | 0.27%(+0.175)#48 | 0.15%(+0.299)#838 |
| 49. | Annapolis Neck | 0.43% | 0.27%(+0.161)#49 | 0.15%(+0.286)#850 |
| 50. | Ilchester | 0.42% | 0.27%(+0.150)#50 | 0.15%(+0.274)#866 |
| 51. | Bel Air | 0.38% | 0.27%(+0.105)#51 | 0.15%(+0.229)#947 |
| 52. | White Oak | 0.37% | 0.27%(+0.103)#52 | 0.15%(+0.227)#955 |
| 53. | Chevy Chase | 0.36% | 0.27%(+0.086)#53 | 0.15%(+0.210)#991 |
| 54. | Linganore | 0.35% | 0.27%(+0.083)#54 | 0.15%(+0.207)#1,003 |
| 55. | Aspen Hill | 0.34% | 0.27%(+0.073)#55 | 0.15%(+0.197)#1,027 |
| 56. | Annapolis | 0.31% | 0.27%(+0.043)#56 | 0.15%(+0.167)#1,113 |
| 57. | Chesapeake Ranch Estates | 0.31% | 0.27%(+0.038)#57 | 0.15%(+0.162)#1,124 |
| 58. | Arbutus | 0.31% | 0.27%(+0.037)#58 | 0.15%(+0.161)#1,127 |
| 59. | Hyattsville | 0.28% | 0.27%(+0.007)#59 | 0.15%(+0.131)#1,209 |
| 60. | Silver Spring | 0.27% | 0.27%(+0.003)#60 | 0.15%(+0.127)#1,219 |
| 61. | Scaggsville | 0.26% | 0.27%(-0.012)#61 | 0.15%(+0.112)#1,269 |
| 62. | College Park | 0.25% | 0.27%(-0.021)#62 | 0.15%(+0.103)#1,301 |
| 63. | Cloverly | 0.23% | 0.27%(-0.040)#63 | 0.15%(+0.084)#1,373 |
| 64. | Baltimore | 0.21% | 0.27%(-0.058)#64 | 0.15%(+0.066)#1,437 |
| 65. | Grantsville | 0.21% | 0.27%(-0.062)#65 | 0.15%(+0.062)#1,452 |
| 66. | Jessup | 0.21% | 0.27%(-0.063)#66 | 0.15%(+0.061)#1,457 |
| 67. | Fairland | 0.20% | 0.27%(-0.067)#67 | 0.15%(+0.057)#1,475 |
| 68. | Martin S Additions | 0.20% | 0.27%(-0.070)#68 | 0.15%(+0.054)#1,485 |
| 69. | Bowie | 0.18% | 0.27%(-0.086)#69 | 0.15%(+0.038)#1,542 |
| 70. | Easton | 0.18% | 0.27%(-0.090)#70 | 0.15%(+0.034)#1,556 |
| 71. | Clarksburg | 0.18% | 0.27%(-0.091)#71 | 0.15%(+0.033)#1,559 |
| 72. | Chevy Chase View | 0.18% | 0.27%(-0.093)#72 | 0.15%(+0.031)#1,577 |
| 73. | Bel Air South | 0.17% | 0.27%(-0.101)#73 | 0.15%(+0.023)#1,620 |
| 74. | Wheaton | 0.16% | 0.27%(-0.110)#74 | 0.15%(+0.014)#1,668 |
| 75. | Randallstown | 0.16% | 0.27%(-0.111)#75 | 0.15%(+0.013)#1,669 |
| 76. | Marlton | 0.16% | 0.27%(-0.114)#76 | 0.15%(+0.010)#1,682 |
| 77. | Milford Mill | 0.16% | 0.27%(-0.116)#77 | 0.15%(+0.008)#1,695 |
| 78. | Owings Mills | 0.15% | 0.27%(-0.123)#78 | 0.15%(+0.001)#1,735 |
| 79. | Parkville | 0.14% | 0.27%(-0.130)#79 | 0.15%(-0.006)#1,781 |
| 80. | Hillandale | 0.14% | 0.27%(-0.131)#80 | 0.15%(-0.007)#1,789 |
| 81. | Woodmore | 0.14% | 0.27%(-0.134)#81 | 0.15%(-0.010)#1,803 |
| 82. | Adelphi | 0.14% | 0.27%(-0.135)#82 | 0.15%(-0.011)#1,815 |
| 83. | Arnold | 0.13% | 0.27%(-0.138)#83 | 0.15%(-0.014)#1,827 |
| 84. | Essex | 0.13% | 0.27%(-0.141)#84 | 0.15%(-0.017)#1,851 |
| 85. | Four Corners | 0.13% | 0.27%(-0.142)#85 | 0.15%(-0.018)#1,857 |
| 86. | Edgewater | 0.12% | 0.27%(-0.148)#86 | 0.15%(-0.024)#1,887 |
| 87. | Salisbury | 0.12% | 0.27%(-0.150)#87 | 0.15%(-0.026)#1,894 |
| 88. | Berwyn Heights | 0.12% | 0.27%(-0.150)#88 | 0.15%(-0.026)#1,898 |
| 89. | Fort Meade | 0.12% | 0.27%(-0.151)#89 | 0.15%(-0.027)#1,908 |
| 90. | Green Valley | 0.12% | 0.27%(-0.156)#90 | 0.15%(-0.032)#1,941 |
| 91. | Reisterstown | 0.11% | 0.27%(-0.163)#91 | 0.15%(-0.039)#1,976 |
| 92. | Parole | 0.097% | 0.27%(-0.174)#92 | 0.15%(-0.050)#2,068 |
| 93. | Suitland | 0.093% | 0.27%(-0.178)#93 | 0.15%(-0.054)#2,110 |
| 94. | South Laurel | 0.088% | 0.27%(-0.183)#94 | 0.15%(-0.059)#2,140 |
| 95. | Cape St Claire | 0.087% | 0.27%(-0.184)#95 | 0.15%(-0.060)#2,154 |
| 96. | Accokeek | 0.078% | 0.27%(-0.193)#96 | 0.15%(-0.069)#2,225 |
| 97. | Fort Washington | 0.077% | 0.27%(-0.194)#97 | 0.15%(-0.070)#2,234 |
| 98. | Frederick | 0.065% | 0.27%(-0.206)#98 | 0.15%(-0.082)#2,352 |
| 99. | Hagerstown | 0.065% | 0.27%(-0.207)#99 | 0.15%(-0.083)#2,356 |
| 100. | Severna Park | 0.062% | 0.27%(-0.209)#100 | 0.15%(-0.085)#2,372 |
Common Questions
What are the Top 10 Cities with the Highest Percentage of Iranian Population in Maryland?
Top 10 Cities with the Highest Percentage of Iranian Population in Maryland are:
#1
4.55%
#2
3.53%
#3
3.49%
#4
3.27%
#5
2.95%
#6
2.65%
#7
2.14%
#8
2.03%
#9
1.76%
#10
1.71%
What city has the Highest Percentage of Iranian Population in Maryland?
Travilah has the Highest Percentage of Iranian Population in Maryland with 4.55%.
What is the Percentage of Iranian Population in the State of Maryland?
Percentage of Iranian Population in Maryland is 0.27%.
What is the Percentage of Iranian Population in the United States?
Percentage of Iranian Population in the United States is 0.15%.