Cities with the Highest Percentage of Iranian Population in the United States
RELATED REPORTS & OPTIONS
Iranian
United States
Compare Cities
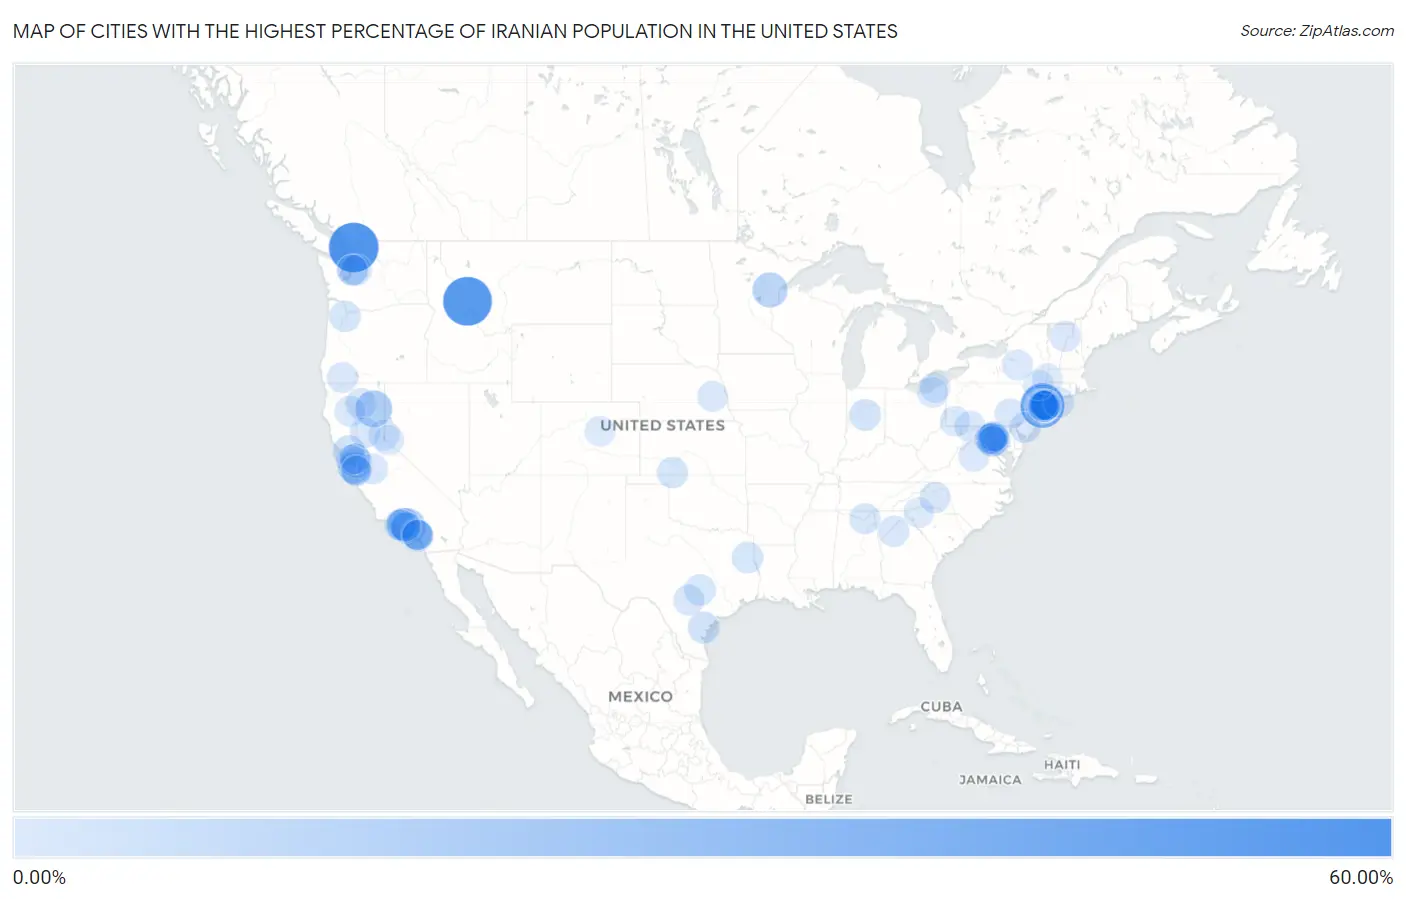
Map of Cities with the Highest Percentage of Iranian Population in the United States
0.00%
60.00%
Cities with the Highest Percentage of Iranian Population in the United States
| City | Iranian | vs State | vs National | |
| 1. | Acme | 52.21% | 0.20%(+52.0)#1 | 0.15%(+52.1)#1 |
| 2. | Charlos Heights | 50.00% | 0.035%(+50.0)#1 | 0.15%(+49.9)#2 |
| 3. | Kings Point | 36.42% | 0.14%(+36.3)#1 | 0.15%(+36.3)#3 |
| 4. | Saddle Rock Estates | 35.51% | 0.14%(+35.4)#2 | 0.15%(+35.4)#4 |
| 5. | Saddle Rock | 25.85% | 0.14%(+25.7)#3 | 0.15%(+25.7)#5 |
| 6. | Great Neck Gardens | 21.60% | 0.14%(+21.5)#4 | 0.15%(+21.5)#6 |
| 7. | Spaulding | 18.45% | 0.54%(+17.9)#1 | 0.15%(+18.3)#7 |
| 8. | Encantado | 16.88% | 0.065%(+16.8)#1 | 0.15%(+16.7)#8 |
| 9. | Beverly Hills | 16.51% | 0.54%(+16.0)#2 | 0.15%(+16.4)#9 |
| 10. | Harbor Hills | 16.23% | 0.14%(+16.1)#5 | 0.15%(+16.1)#10 |
| 11. | Great Neck | 15.02% | 0.14%(+14.9)#6 | 0.15%(+14.9)#11 |
| 12. | Cromwell | 14.21% | 0.059%(+14.1)#1 | 0.15%(+14.1)#12 |
| 13. | Kensington | 13.77% | 0.14%(+13.6)#7 | 0.15%(+13.6)#13 |
| 14. | Great Neck Estates | 12.16% | 0.14%(+12.0)#8 | 0.15%(+12.0)#14 |
| 15. | Calabasas | 9.92% | 0.54%(+9.39)#3 | 0.15%(+9.78)#15 |
| 16. | New Vernon | 8.52% | 0.080%(+8.44)#1 | 0.15%(+8.37)#16 |
| 17. | Great Neck Plaza | 8.41% | 0.14%(+8.27)#9 | 0.15%(+8.26)#17 |
| 18. | Thomaston | 6.98% | 0.14%(+6.84)#10 | 0.15%(+6.83)#18 |
| 19. | Loyola | 6.86% | 0.54%(+6.33)#4 | 0.15%(+6.72)#19 |
| 20. | Roslyn Heights | 6.74% | 0.14%(+6.60)#11 | 0.15%(+6.59)#20 |
| 21. | Bell Canyon | 6.56% | 0.54%(+6.03)#5 | 0.15%(+6.41)#21 |
| 22. | West Menlo Park | 6.56% | 0.54%(+6.02)#6 | 0.15%(+6.41)#22 |
| 23. | Morgan Farm | 6.45% | 0.13%(+6.32)#1 | 0.15%(+6.30)#23 |
| 24. | Glen Ellen | 6.41% | 0.54%(+5.88)#7 | 0.15%(+6.27)#24 |
| 25. | Roslyn Estates | 6.30% | 0.14%(+6.15)#12 | 0.15%(+6.15)#25 |
| 26. | Kempton | 5.71% | 0.041%(+5.67)#1 | 0.15%(+5.57)#26 |
| 27. | Beckville | 5.43% | 0.13%(+5.29)#2 | 0.15%(+5.28)#27 |
| 28. | Clyde Hill | 5.41% | 0.20%(+5.21)#2 | 0.15%(+5.26)#28 |
| 29. | Las Flores Cdp Orange County | 5.35% | 0.54%(+4.81)#8 | 0.15%(+5.20)#29 |
| 30. | Muttontown | 5.23% | 0.14%(+5.09)#13 | 0.15%(+5.08)#30 |
| 31. | King City | 5.14% | 0.16%(+4.98)#1 | 0.15%(+4.99)#31 |
| 32. | Lost Creek | 5.09% | 0.13%(+4.96)#3 | 0.15%(+4.94)#32 |
| 33. | Norris Canyon | 5.03% | 0.54%(+4.50)#9 | 0.15%(+4.88)#33 |
| 34. | Ashland | 4.86% | 0.082%(+4.78)#1 | 0.15%(+4.72)#34 |
| 35. | Lake Sherwood | 4.82% | 0.54%(+4.29)#10 | 0.15%(+4.68)#35 |
| 36. | Laguna Niguel | 4.78% | 0.54%(+4.25)#11 | 0.15%(+4.64)#36 |
| 37. | Great Falls | 4.77% | 0.24%(+4.53)#1 | 0.15%(+4.62)#37 |
| 38. | St Stephens | 4.64% | 0.065%(+4.58)#1 | 0.15%(+4.50)#38 |
| 39. | Westlake Village | 4.64% | 0.54%(+4.11)#12 | 0.15%(+4.50)#39 |
| 40. | Ames Lake | 4.60% | 0.20%(+4.41)#3 | 0.15%(+4.46)#40 |
| 41. | Tysons | 4.58% | 0.24%(+4.34)#2 | 0.15%(+4.43)#41 |
| 42. | Travilah | 4.55% | 0.27%(+4.27)#1 | 0.15%(+4.40)#42 |
| 43. | Greenvale | 4.47% | 0.14%(+4.32)#14 | 0.15%(+4.32)#43 |
| 44. | Old Westbury | 4.38% | 0.14%(+4.23)#15 | 0.15%(+4.23)#44 |
| 45. | Albertson | 4.36% | 0.14%(+4.21)#16 | 0.15%(+4.21)#45 |
| 46. | Flower Hill | 4.28% | 0.14%(+4.14)#17 | 0.15%(+4.14)#46 |
| 47. | Victory Lakes | 4.16% | 0.080%(+4.08)#2 | 0.15%(+4.01)#47 |
| 48. | Pine Lake | 4.05% | 0.10%(+3.95)#1 | 0.15%(+3.91)#48 |
| 49. | Burney | 4.05% | 0.54%(+3.51)#13 | 0.15%(+3.90)#49 |
| 50. | New Canaan | 3.96% | 0.077%(+3.89)#1 | 0.15%(+3.82)#50 |
| 51. | Grant | 3.96% | 0.037%(+3.92)#1 | 0.15%(+3.81)#51 |
| 52. | Cross Mountain | 3.87% | 0.13%(+3.74)#4 | 0.15%(+3.72)#52 |
| 53. | Cascades | 3.86% | 0.24%(+3.62)#3 | 0.15%(+3.71)#53 |
| 54. | Laguna Hills | 3.82% | 0.54%(+3.29)#14 | 0.15%(+3.68)#54 |
| 55. | Danville | 3.78% | 0.065%(+3.71)#1 | 0.15%(+3.63)#55 |
| 56. | Jacksonville | 3.72% | 0.16%(+3.57)#2 | 0.15%(+3.58)#56 |
| 57. | Centerville | 3.72% | 0.54%(+3.19)#15 | 0.15%(+3.57)#57 |
| 58. | Contra Costa Centre | 3.72% | 0.54%(+3.18)#16 | 0.15%(+3.57)#58 |
| 59. | Tahoe Vista | 3.67% | 0.54%(+3.14)#17 | 0.15%(+3.52)#59 |
| 60. | Upper Brookville | 3.67% | 0.14%(+3.53)#18 | 0.15%(+3.52)#60 |
| 61. | Oriskany Falls | 3.66% | 0.14%(+3.52)#19 | 0.15%(+3.52)#61 |
| 62. | Irvine | 3.56% | 0.54%(+3.03)#18 | 0.15%(+3.42)#62 |
| 63. | Countryside | 3.56% | 0.24%(+3.32)#4 | 0.15%(+3.41)#63 |
| 64. | Potomac | 3.53% | 0.27%(+3.26)#2 | 0.15%(+3.38)#64 |
| 65. | Lafayette | 3.49% | 0.54%(+2.95)#19 | 0.15%(+3.34)#65 |
| 66. | Corriganville | 3.49% | 0.27%(+3.22)#3 | 0.15%(+3.34)#66 |
| 67. | Maverick Mountain | 3.45% | 0.035%(+3.41)#2 | 0.15%(+3.30)#67 |
| 68. | Jamesport | 3.43% | 0.14%(+3.28)#20 | 0.15%(+3.28)#68 |
| 69. | Abie | 3.39% | 0.050%(+3.34)#1 | 0.15%(+3.24)#69 |
| 70. | Governors | 3.38% | 0.065%(+3.31)#2 | 0.15%(+3.23)#70 |
| 71. | Hilmar Irwin | 3.35% | 0.54%(+2.81)#20 | 0.15%(+3.20)#71 |
| 72. | Friendship Heights Village | 3.27% | 0.27%(+3.00)#4 | 0.15%(+3.12)#72 |
| 73. | Bangor | 3.26% | 0.54%(+2.72)#21 | 0.15%(+3.11)#73 |
| 74. | Lowes Island | 3.25% | 0.24%(+3.01)#5 | 0.15%(+3.10)#74 |
| 75. | Emeryville | 3.22% | 0.54%(+2.69)#22 | 0.15%(+3.08)#75 |
| 76. | Aliso Viejo | 3.22% | 0.54%(+2.68)#23 | 0.15%(+3.07)#76 |
| 77. | Mission Viejo | 3.17% | 0.54%(+2.64)#24 | 0.15%(+3.02)#77 |
| 78. | Spring Ridge | 3.12% | 0.053%(+3.06)#1 | 0.15%(+2.97)#78 |
| 79. | Ivy | 3.08% | 0.24%(+2.84)#6 | 0.15%(+2.93)#79 |
| 80. | Oakland Cdp Cambria County | 3.06% | 0.053%(+3.01)#2 | 0.15%(+2.91)#80 |
| 81. | Darnestown | 2.95% | 0.27%(+2.68)#5 | 0.15%(+2.81)#81 |
| 82. | Housatonic | 2.94% | 0.14%(+2.81)#1 | 0.15%(+2.80)#82 |
| 83. | East Valley | 2.94% | 0.20%(+2.73)#1 | 0.15%(+2.79)#83 |
| 84. | Hiller | 2.93% | 0.053%(+2.88)#3 | 0.15%(+2.78)#84 |
| 85. | Los Gatos | 2.89% | 0.54%(+2.35)#25 | 0.15%(+2.74)#85 |
| 86. | Castle Pines | 2.88% | 0.12%(+2.76)#1 | 0.15%(+2.73)#86 |
| 87. | Saratoga | 2.86% | 0.54%(+2.32)#26 | 0.15%(+2.71)#87 |
| 88. | Santa Monica | 2.85% | 0.54%(+2.32)#27 | 0.15%(+2.71)#88 |
| 89. | Strawberry Cdp Marin County | 2.81% | 0.54%(+2.27)#28 | 0.15%(+2.66)#89 |
| 90. | Hillside | 2.79% | 0.14%(+2.64)#21 | 0.15%(+2.64)#90 |
| 91. | Yarrow Point | 2.73% | 0.20%(+2.54)#4 | 0.15%(+2.59)#91 |
| 92. | Oyster Bay Cove | 2.73% | 0.14%(+2.59)#22 | 0.15%(+2.58)#92 |
| 93. | Dunn Loring | 2.72% | 0.24%(+2.48)#7 | 0.15%(+2.57)#93 |
| 94. | Pepper Pike | 2.71% | 0.047%(+2.67)#1 | 0.15%(+2.57)#94 |
| 95. | Essex Fells Borough | 2.66% | 0.080%(+2.58)#3 | 0.15%(+2.52)#95 |
| 96. | Grand River | 2.66% | 0.047%(+2.61)#2 | 0.15%(+2.51)#96 |
| 97. | City View | 2.65% | 0.040%(+2.61)#1 | 0.15%(+2.51)#97 |
| 98. | Washington Grove | 2.65% | 0.27%(+2.38)#6 | 0.15%(+2.50)#98 |
| 99. | Topanga | 2.65% | 0.54%(+2.11)#29 | 0.15%(+2.50)#99 |
| 100. | Manorhaven | 2.58% | 0.14%(+2.44)#23 | 0.15%(+2.44)#100 |
Common Questions
What are the Top 10 Cities with the Highest Percentage of Iranian Population in the United States?
Top 10 Cities with the Highest Percentage of Iranian Population in the United States are:
#1
52.21%
#2
50.00%
#3
36.42%
#4
35.51%
#5
25.85%
#6
21.60%
#7
18.45%
#8
16.51%
#9
16.23%
#10
15.02%
What city has the Highest Percentage of Iranian Population in the United States?
Acme has the Highest Percentage of Iranian Population in the United States with 52.21%.
What is the Percentage of Iranian Population in the United States?
Percentage of Iranian Population in the United States is 0.15%.