Cities with the Highest Percentage of Iranian Population in Virginia
RELATED REPORTS & OPTIONS
Iranian
Virginia
Compare Cities
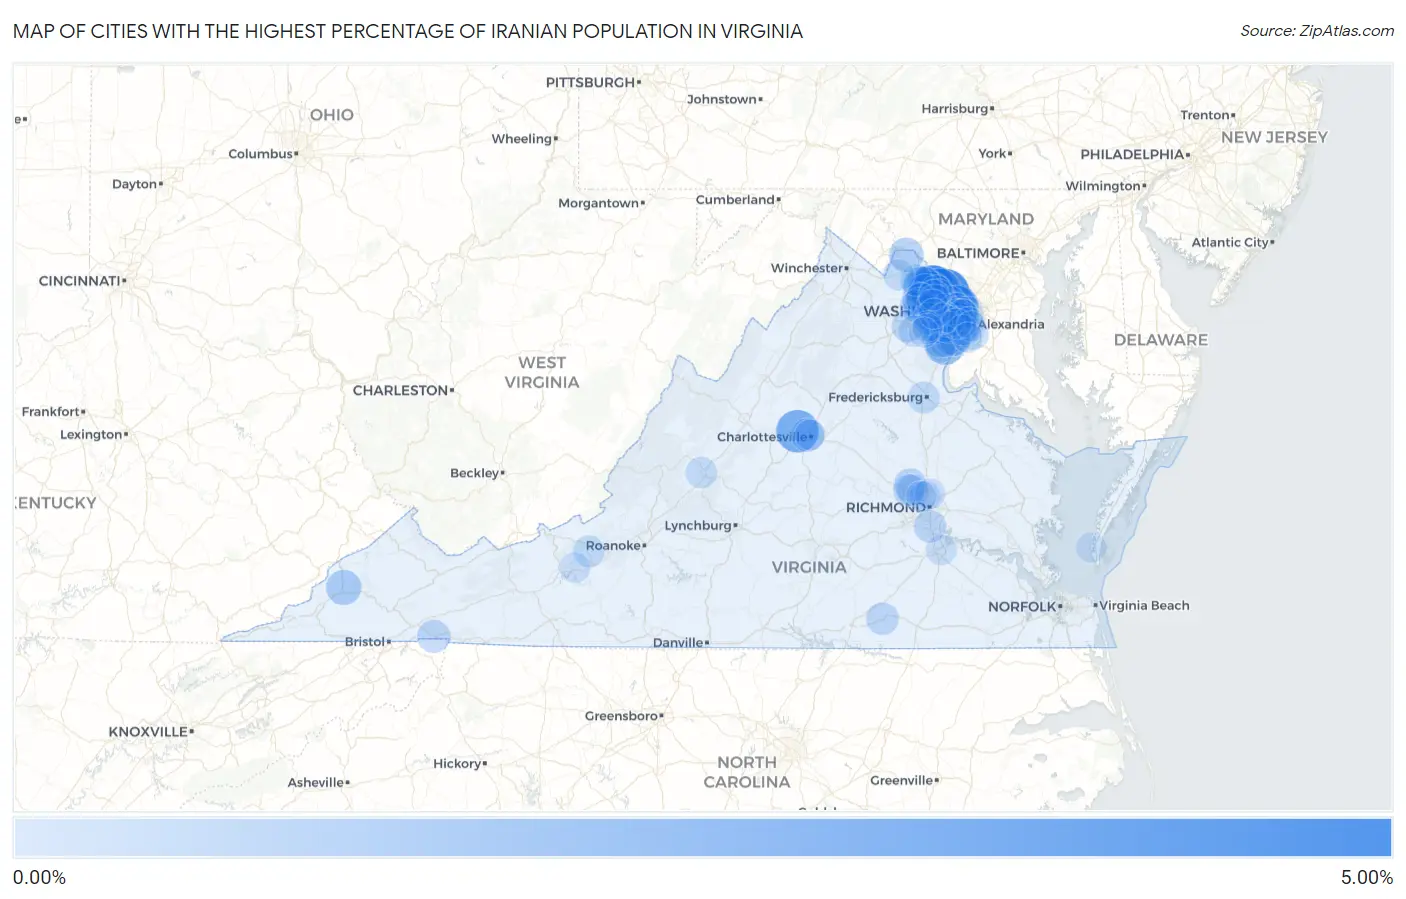
Map of Cities with the Highest Percentage of Iranian Population in Virginia
0.00%
5.00%
Cities with the Highest Percentage of Iranian Population in Virginia
| City | Iranian | vs State | vs National | |
| 1. | Great Falls | 4.77% | 0.24%(+4.53)#1 | 0.15%(+4.62)#37 |
| 2. | Tysons | 4.58% | 0.24%(+4.34)#2 | 0.15%(+4.43)#41 |
| 3. | Cascades | 3.86% | 0.24%(+3.62)#3 | 0.15%(+3.71)#53 |
| 4. | Countryside | 3.56% | 0.24%(+3.32)#4 | 0.15%(+3.41)#63 |
| 5. | Lowes Island | 3.25% | 0.24%(+3.01)#5 | 0.15%(+3.10)#74 |
| 6. | Ivy | 3.08% | 0.24%(+2.84)#6 | 0.15%(+2.93)#79 |
| 7. | Dunn Loring | 2.72% | 0.24%(+2.48)#7 | 0.15%(+2.57)#93 |
| 8. | Idylwood | 2.41% | 0.24%(+2.17)#8 | 0.15%(+2.26)#113 |
| 9. | Dulles Town Center | 2.29% | 0.24%(+2.05)#9 | 0.15%(+2.15)#120 |
| 10. | Mclean | 2.27% | 0.24%(+2.03)#10 | 0.15%(+2.12)#122 |
| 11. | Belmont | 2.17% | 0.24%(+1.93)#11 | 0.15%(+2.03)#126 |
| 12. | Rio | 2.17% | 0.24%(+1.93)#12 | 0.15%(+2.02)#128 |
| 13. | Vienna | 1.98% | 0.24%(+1.74)#13 | 0.15%(+1.83)#142 |
| 14. | Potomac Mills | 1.77% | 0.24%(+1.53)#14 | 0.15%(+1.62)#168 |
| 15. | Wolf Trap | 1.73% | 0.24%(+1.49)#15 | 0.15%(+1.58)#176 |
| 16. | Franconia | 1.69% | 0.24%(+1.45)#16 | 0.15%(+1.55)#184 |
| 17. | Fairfax Station | 1.68% | 0.24%(+1.44)#17 | 0.15%(+1.53)#186 |
| 18. | Kings Park | 1.67% | 0.24%(+1.43)#18 | 0.15%(+1.53)#187 |
| 19. | Camp Barrett | 1.66% | 0.24%(+1.42)#19 | 0.15%(+1.51)#191 |
| 20. | Fair Oaks | 1.54% | 0.24%(+1.30)#20 | 0.15%(+1.39)#221 |
| 21. | One Loudoun | 1.51% | 0.24%(+1.27)#21 | 0.15%(+1.36)#226 |
| 22. | Fair Lakes | 1.50% | 0.24%(+1.26)#22 | 0.15%(+1.36)#229 |
| 23. | Woodburn | 1.42% | 0.24%(+1.18)#23 | 0.15%(+1.27)#248 |
| 24. | Lake Barcroft | 1.30% | 0.24%(+1.06)#24 | 0.15%(+1.16)#280 |
| 25. | Wise | 1.28% | 0.24%(+1.04)#25 | 0.15%(+1.14)#281 |
| 26. | Reston | 1.27% | 0.24%(+1.03)#26 | 0.15%(+1.12)#285 |
| 27. | County Center | 1.24% | 0.24%(+1.00)#27 | 0.15%(+1.10)#293 |
| 28. | Laurel Hill | 1.20% | 0.24%(+0.960)#28 | 0.15%(+1.05)#309 |
| 29. | Lansdowne | 1.19% | 0.24%(+0.952)#29 | 0.15%(+1.04)#315 |
| 30. | Franklin Farm | 1.19% | 0.24%(+0.951)#30 | 0.15%(+1.04)#317 |
| 31. | Dranesville | 1.18% | 0.24%(+0.945)#31 | 0.15%(+1.04)#318 |
| 32. | Ashburn | 1.17% | 0.24%(+0.930)#32 | 0.15%(+1.02)#330 |
| 33. | Chantilly | 1.16% | 0.24%(+0.920)#33 | 0.15%(+1.01)#335 |
| 34. | Lovettsville | 1.13% | 0.24%(+0.886)#34 | 0.15%(+0.978)#351 |
| 35. | South Riding | 1.02% | 0.24%(+0.780)#35 | 0.15%(+0.872)#384 |
| 36. | Difficult Run | 0.97% | 0.24%(+0.728)#36 | 0.15%(+0.821)#402 |
| 37. | Annandale | 0.92% | 0.24%(+0.682)#37 | 0.15%(+0.774)#421 |
| 38. | Merrifield | 0.92% | 0.24%(+0.679)#38 | 0.15%(+0.771)#422 |
| 39. | University Of Virginia | 0.87% | 0.24%(+0.631)#39 | 0.15%(+0.724)#442 |
| 40. | Brambleton | 0.86% | 0.24%(+0.616)#40 | 0.15%(+0.708)#450 |
| 41. | Damascus | 0.78% | 0.24%(+0.543)#41 | 0.15%(+0.635)#477 |
| 42. | Oakton | 0.76% | 0.24%(+0.521)#42 | 0.15%(+0.614)#492 |
| 43. | Wyndham | 0.76% | 0.24%(+0.520)#43 | 0.15%(+0.613)#496 |
| 44. | Braddock | 0.74% | 0.24%(+0.499)#44 | 0.15%(+0.592)#509 |
| 45. | Stone Ridge | 0.72% | 0.24%(+0.477)#45 | 0.15%(+0.569)#526 |
| 46. | Falls Church | 0.67% | 0.24%(+0.433)#46 | 0.15%(+0.525)#566 |
| 47. | Bellwood | 0.67% | 0.24%(+0.429)#47 | 0.15%(+0.521)#569 |
| 48. | Lawrenceville | 0.67% | 0.24%(+0.428)#48 | 0.15%(+0.520)#570 |
| 49. | Fort Hunt | 0.63% | 0.24%(+0.391)#49 | 0.15%(+0.484)#596 |
| 50. | Sugarland Run | 0.59% | 0.24%(+0.345)#50 | 0.15%(+0.438)#657 |
| 51. | Arcola | 0.57% | 0.24%(+0.335)#51 | 0.15%(+0.427)#670 |
| 52. | Gainesville | 0.57% | 0.24%(+0.332)#52 | 0.15%(+0.424)#672 |
| 53. | Arlington | 0.56% | 0.24%(+0.325)#53 | 0.15%(+0.418)#680 |
| 54. | Clifton | 0.56% | 0.24%(+0.319)#54 | 0.15%(+0.412)#687 |
| 55. | Fredericksburg | 0.54% | 0.24%(+0.302)#55 | 0.15%(+0.394)#708 |
| 56. | Centreville | 0.53% | 0.24%(+0.293)#56 | 0.15%(+0.385)#716 |
| 57. | Pimmit Hills | 0.52% | 0.24%(+0.283)#57 | 0.15%(+0.376)#734 |
| 58. | Lincolnia | 0.51% | 0.24%(+0.275)#58 | 0.15%(+0.368)#739 |
| 59. | Innsbrook | 0.49% | 0.24%(+0.255)#59 | 0.15%(+0.347)#766 |
| 60. | Leesburg | 0.48% | 0.24%(+0.243)#60 | 0.15%(+0.336)#785 |
| 61. | West Falls Church | 0.48% | 0.24%(+0.242)#61 | 0.15%(+0.335)#788 |
| 62. | Lexington | 0.48% | 0.24%(+0.237)#62 | 0.15%(+0.329)#792 |
| 63. | Lorton | 0.47% | 0.24%(+0.232)#63 | 0.15%(+0.325)#797 |
| 64. | Burke | 0.46% | 0.24%(+0.222)#64 | 0.15%(+0.314)#810 |
| 65. | Seven Corners | 0.46% | 0.24%(+0.220)#65 | 0.15%(+0.312)#814 |
| 66. | Loudoun Valley Estates | 0.46% | 0.24%(+0.217)#66 | 0.15%(+0.309)#819 |
| 67. | Blacksburg | 0.45% | 0.24%(+0.212)#67 | 0.15%(+0.305)#828 |
| 68. | Short Pump | 0.45% | 0.24%(+0.208)#68 | 0.15%(+0.300)#836 |
| 69. | Burke Centre | 0.44% | 0.24%(+0.196)#69 | 0.15%(+0.288)#848 |
| 70. | Lake Ridge | 0.43% | 0.24%(+0.192)#70 | 0.15%(+0.284)#853 |
| 71. | Purcellville | 0.43% | 0.24%(+0.186)#71 | 0.15%(+0.278)#862 |
| 72. | Hutchison | 0.42% | 0.24%(+0.178)#72 | 0.15%(+0.270)#875 |
| 73. | Fairfax | 0.39% | 0.24%(+0.148)#73 | 0.15%(+0.241)#923 |
| 74. | Linton Hall | 0.38% | 0.24%(+0.144)#74 | 0.15%(+0.237)#930 |
| 75. | Long Branch | 0.37% | 0.24%(+0.127)#75 | 0.15%(+0.220)#973 |
| 76. | Herndon | 0.34% | 0.24%(+0.096)#76 | 0.15%(+0.188)#1,049 |
| 77. | Floris | 0.32% | 0.24%(+0.084)#77 | 0.15%(+0.176)#1,084 |
| 78. | Radford | 0.29% | 0.24%(+0.047)#78 | 0.15%(+0.140)#1,187 |
| 79. | Alexandria | 0.28% | 0.24%(+0.042)#79 | 0.15%(+0.135)#1,206 |
| 80. | George Mason | 0.27% | 0.24%(+0.030)#80 | 0.15%(+0.122)#1,237 |
| 81. | Fort Lee | 0.26% | 0.24%(+0.024)#81 | 0.15%(+0.117)#1,258 |
| 82. | Lakeside | 0.25% | 0.24%(+0.008)#82 | 0.15%(+0.100)#1,316 |
| 83. | Chamberlayne | 0.24% | 0.24%(+0.002)#83 | 0.15%(+0.095)#1,337 |
| 84. | Kingstowne | 0.22% | 0.24%(-0.015)#84 | 0.15%(+0.078)#1,392 |
| 85. | Charlottesville | 0.21% | 0.24%(-0.028)#85 | 0.15%(+0.065)#1,441 |
| 86. | Sterling | 0.21% | 0.24%(-0.030)#86 | 0.15%(+0.062)#1,450 |
| 87. | Dumbarton | 0.21% | 0.24%(-0.034)#87 | 0.15%(+0.058)#1,465 |
| 88. | North Springfield | 0.19% | 0.24%(-0.052)#88 | 0.15%(+0.041)#1,530 |
| 89. | Dale City | 0.19% | 0.24%(-0.054)#89 | 0.15%(+0.038)#1,539 |
| 90. | Yorkshire | 0.18% | 0.24%(-0.060)#90 | 0.15%(+0.033)#1,561 |
| 91. | Manassas Park | 0.17% | 0.24%(-0.070)#91 | 0.15%(+0.022)#1,624 |
| 92. | Cape Charles | 0.17% | 0.24%(-0.071)#92 | 0.15%(+0.022)#1,627 |
| 93. | Greenbriar | 0.16% | 0.24%(-0.076)#93 | 0.15%(+0.016)#1,650 |
| 94. | Manassas | 0.16% | 0.24%(-0.082)#94 | 0.15%(+0.010)#1,685 |
| 95. | Huntington | 0.15% | 0.24%(-0.089)#95 | 0.15%(+0.004)#1,722 |
| 96. | Woodlawn Cdp Fairfax County | 0.15% | 0.24%(-0.092)#96 | 0.15%(+0.001)#1,738 |
| 97. | Moorefield | 0.15% | 0.24%(-0.094)#97 | 0.15%(-0.001)#1,755 |
| 98. | Mount Vernon | 0.14% | 0.24%(-0.097)#98 | 0.15%(-0.004)#1,773 |
| 99. | Navy | 0.14% | 0.24%(-0.102)#99 | 0.15%(-0.010)#1,802 |
| 100. | Rose Hill Cdp Fairfax County | 0.14% | 0.24%(-0.103)#100 | 0.15%(-0.010)#1,809 |
Common Questions
What are the Top 10 Cities with the Highest Percentage of Iranian Population in Virginia?
Top 10 Cities with the Highest Percentage of Iranian Population in Virginia are:
#1
4.77%
#2
4.58%
#3
3.86%
#4
3.56%
#5
3.25%
#6
3.08%
#7
2.72%
#8
2.41%
#9
2.29%
#10
2.27%
What city has the Highest Percentage of Iranian Population in Virginia?
Great Falls has the Highest Percentage of Iranian Population in Virginia with 4.77%.
What is the Percentage of Iranian Population in the State of Virginia?
Percentage of Iranian Population in Virginia is 0.24%.
What is the Percentage of Iranian Population in the United States?
Percentage of Iranian Population in the United States is 0.15%.