Cities with the Lowest Poverty Level in Vermont
RELATED REPORTS & OPTIONS
Lowest Poverty
Vermont
Compare Cities
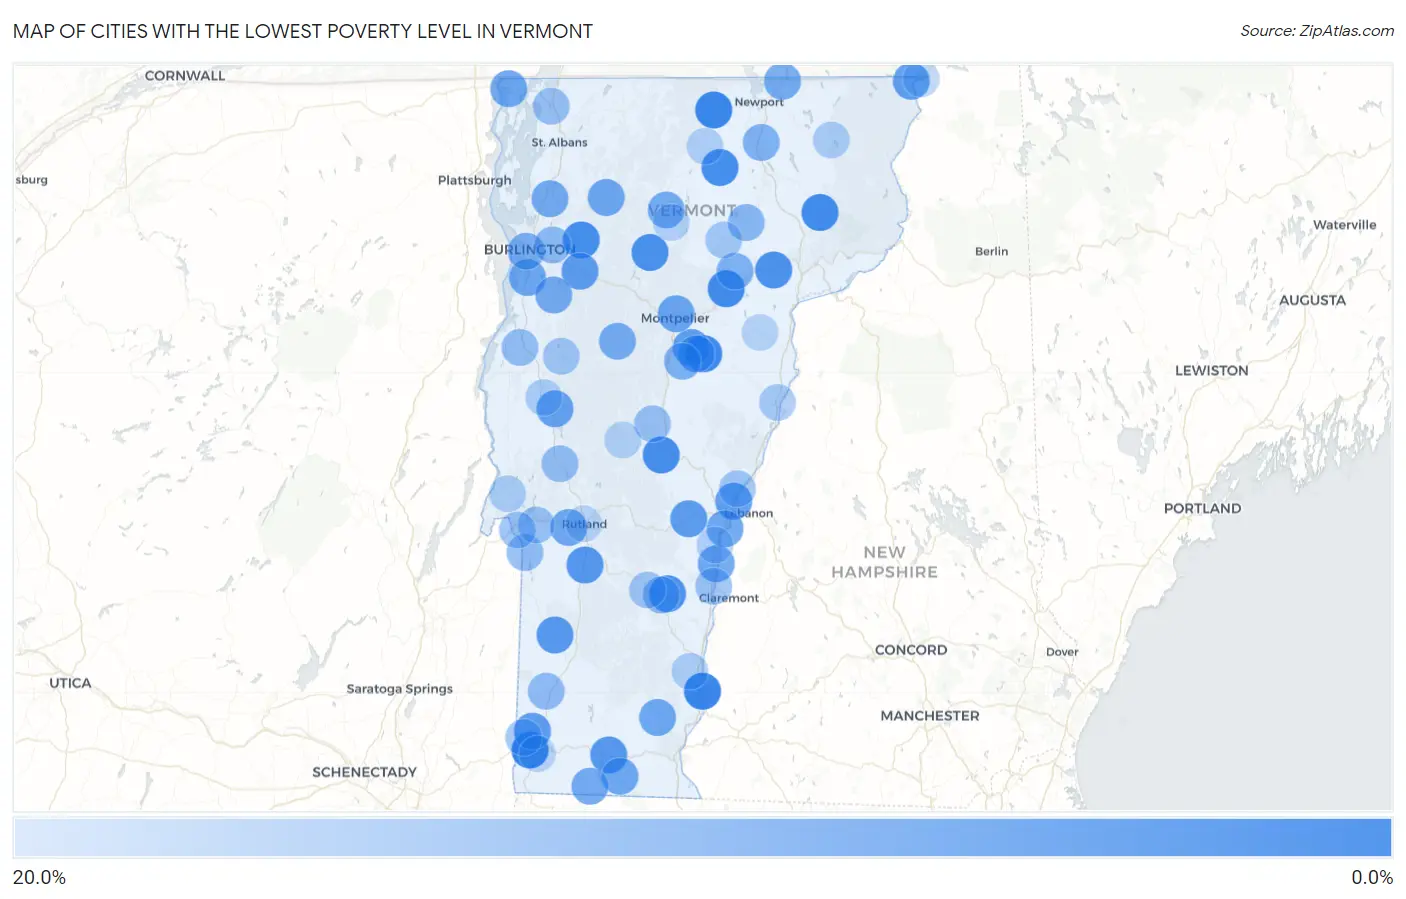
Map of Cities with the Lowest Poverty Level in Vermont
20.0%
0.0%
Cities with the Lowest Poverty Level in Vermont
| City | Poverty | vs State | vs National | |
| 1. | Westminster | 0.50% | 10.4%(-9.93)#1 | 12.5%(-12.0)#122 |
| 2. | Old Bennington | 0.62% | 10.4%(-9.81)#2 | 12.5%(-11.9)#165 |
| 3. | Troy | 0.73% | 10.4%(-9.70)#3 | 12.5%(-11.8)#223 |
| 4. | East Barre | 1.4% | 10.4%(-9.00)#4 | 12.5%(-11.1)#653 |
| 5. | Marshfield | 1.7% | 10.4%(-8.75)#5 | 12.5%(-10.9)#856 |
| 6. | East Burke | 1.8% | 10.4%(-8.61)#6 | 12.5%(-10.7)#969 |
| 7. | Albany | 2.0% | 10.4%(-8.44)#7 | 12.5%(-10.5)#1,127 |
| 8. | Wardsboro | 2.0% | 10.4%(-8.39)#8 | 12.5%(-10.5)#1,181 |
| 9. | Jericho | 2.1% | 10.4%(-8.37)#9 | 12.5%(-10.5)#1,202 |
| 10. | Bethel | 2.3% | 10.4%(-8.14)#10 | 12.5%(-10.3)#1,425 |
| 11. | Pownal Center | 2.5% | 10.4%(-7.92)#11 | 12.5%(-10.0)#1,685 |
| 12. | Stowe | 2.6% | 10.4%(-7.79)#12 | 12.5%(-9.90)#1,824 |
| 13. | Cavendish | 2.9% | 10.4%(-7.54)#13 | 12.5%(-9.65)#2,117 |
| 14. | Danville | 2.9% | 10.4%(-7.54)#14 | 12.5%(-9.65)#2,121 |
| 15. | Lincoln | 3.2% | 10.4%(-7.26)#15 | 12.5%(-9.37)#2,421 |
| 16. | North Clarendon | 3.3% | 10.4%(-7.13)#16 | 12.5%(-9.23)#2,614 |
| 17. | East Poultney | 3.5% | 10.4%(-6.90)#17 | 12.5%(-9.01)#2,937 |
| 18. | Underhill Flats | 3.6% | 10.4%(-6.85)#18 | 12.5%(-8.96)#3,019 |
| 19. | South Lincoln | 3.9% | 10.4%(-6.51)#19 | 12.5%(-8.61)#3,474 |
| 20. | Wallingford | 3.9% | 10.4%(-6.48)#20 | 12.5%(-8.59)#3,498 |
| 21. | Dorset | 4.0% | 10.4%(-6.42)#21 | 12.5%(-8.52)#3,605 |
| 22. | Middletown Springs | 4.1% | 10.4%(-6.37)#22 | 12.5%(-8.48)#3,656 |
| 23. | Wilmington | 4.2% | 10.4%(-6.27)#23 | 12.5%(-8.38)#3,797 |
| 24. | St. George | 4.4% | 10.4%(-6.04)#24 | 12.5%(-8.14)#4,106 |
| 25. | Richmond | 4.6% | 10.4%(-5.78)#25 | 12.5%(-7.89)#4,476 |
| 26. | South Shaftsbury | 4.7% | 10.4%(-5.74)#26 | 12.5%(-7.85)#4,528 |
| 27. | Bolton Valley | 4.8% | 10.4%(-5.58)#27 | 12.5%(-7.69)#4,760 |
| 28. | Woodstock | 4.9% | 10.4%(-5.48)#28 | 12.5%(-7.59)#4,886 |
| 29. | South Barre | 5.1% | 10.4%(-5.36)#29 | 12.5%(-7.47)#5,052 |
| 30. | Canaan | 5.2% | 10.4%(-5.18)#30 | 12.5%(-7.29)#5,281 |
| 31. | Wilder | 5.3% | 10.4%(-5.12)#31 | 12.5%(-7.22)#5,385 |
| 32. | East Middlebury | 5.6% | 10.4%(-4.84)#32 | 12.5%(-6.94)#5,805 |
| 33. | Chittenden | 5.8% | 10.4%(-4.66)#33 | 12.5%(-6.77)#6,052 |
| 34. | Shelburne | 6.3% | 10.4%(-4.15)#34 | 12.5%(-6.26)#6,821 |
| 35. | Graniteville | 6.4% | 10.4%(-4.06)#35 | 12.5%(-6.17)#6,945 |
| 36. | Montpelier | 6.4% | 10.4%(-4.00)#36 | 12.5%(-6.11)#7,042 |
| 37. | Wolcott | 6.4% | 10.4%(-3.99)#37 | 12.5%(-6.10)#7,057 |
| 38. | Alburgh | 6.4% | 10.4%(-3.99)#38 | 12.5%(-6.10)#7,063 |
| 39. | Lyndon Center | 6.4% | 10.4%(-3.99)#39 | 12.5%(-6.09)#7,074 |
| 40. | Jacksonville | 6.5% | 10.4%(-3.96)#40 | 12.5%(-6.07)#7,113 |
| 41. | Windsor | 6.5% | 10.4%(-3.96)#41 | 12.5%(-6.07)#7,117 |
| 42. | North Hartland | 6.5% | 10.4%(-3.94)#42 | 12.5%(-6.04)#7,139 |
| 43. | Cambridge | 6.6% | 10.4%(-3.86)#43 | 12.5%(-5.97)#7,244 |
| 44. | Newfane | 6.7% | 10.4%(-3.76)#44 | 12.5%(-5.87)#7,390 |
| 45. | West Rutland | 6.8% | 10.4%(-3.68)#45 | 12.5%(-5.78)#7,503 |
| 46. | Harmonyville | 6.9% | 10.4%(-3.55)#46 | 12.5%(-5.65)#7,704 |
| 47. | Readsboro | 7.0% | 10.4%(-3.38)#47 | 12.5%(-5.49)#7,947 |
| 48. | Hinesburg | 7.2% | 10.4%(-3.21)#48 | 12.5%(-5.32)#8,179 |
| 49. | Milton | 7.4% | 10.4%(-3.05)#49 | 12.5%(-5.15)#8,420 |
| 50. | Waitsfield | 7.5% | 10.4%(-2.97)#50 | 12.5%(-5.08)#8,522 |
| 51. | Derby Line | 7.6% | 10.4%(-2.87)#51 | 12.5%(-4.98)#8,665 |
| 52. | Hyde Park | 7.6% | 10.4%(-2.81)#52 | 12.5%(-4.91)#8,752 |
| 53. | South Burlington | 8.0% | 10.4%(-2.40)#53 | 12.5%(-4.51)#9,301 |
| 54. | Townshend | 8.2% | 10.4%(-2.26)#54 | 12.5%(-4.37)#9,481 |
| 55. | Proctor | 8.4% | 10.4%(-2.07)#55 | 12.5%(-4.18)#9,743 |
| 56. | Pownal | 8.5% | 10.4%(-1.97)#56 | 12.5%(-4.08)#9,868 |
| 57. | Huntington Center | 8.5% | 10.4%(-1.95)#57 | 12.5%(-4.06)#9,894 |
| 58. | Williamstown | 8.6% | 10.4%(-1.83)#58 | 12.5%(-3.94)#10,051 |
| 59. | Cabot | 8.6% | 10.4%(-1.82)#59 | 12.5%(-3.93)#10,081 |
| 60. | Orleans | 8.8% | 10.4%(-1.61)#60 | 12.5%(-3.71)#10,388 |
| 61. | Huntington | 9.0% | 10.4%(-1.43)#61 | 12.5%(-3.54)#10,627 |
| 62. | West Woodstock | 9.3% | 10.4%(-1.11)#62 | 12.5%(-3.21)#11,057 |
| 63. | Proctorsville | 9.6% | 10.4%(-0.806)#63 | 12.5%(-2.91)#11,438 |
| 64. | Greensboro Bend | 9.8% | 10.4%(-0.616)#64 | 12.5%(-2.72)#11,688 |
| 65. | South Londonderry | 9.8% | 10.4%(-0.614)#65 | 12.5%(-2.72)#11,690 |
| 66. | Stamford | 10.1% | 10.4%(-0.296)#66 | 12.5%(-2.40)#12,107 |
| 67. | Weston | 10.3% | 10.4%(-0.171)#67 | 12.5%(-2.28)#12,260 |
| 68. | Essex Junction | 10.3% | 10.4%(-0.133)#68 | 12.5%(-2.24)#12,308 |
| 69. | Arlington | 10.5% | 10.4%(+0.073)#69 | 12.5%(-2.03)#12,575 |
| 70. | Poultney | 10.6% | 10.4%(+0.149)#70 | 12.5%(-1.96)#12,675 |
| 71. | Brandon | 10.9% | 10.4%(+0.432)#71 | 12.5%(-1.68)#13,037 |
| 72. | Vergennes | 10.9% | 10.4%(+0.461)#72 | 12.5%(-1.65)#13,072 |
| 73. | Killington | 10.9% | 10.4%(+0.482)#73 | 12.5%(-1.63)#13,101 |
| 74. | Randolph | 11.3% | 10.4%(+0.870)#74 | 12.5%(-1.24)#13,590 |
| 75. | Castleton | 11.3% | 10.4%(+0.894)#75 | 12.5%(-1.21)#13,620 |
| 76. | Fair Haven | 11.4% | 10.4%(+0.950)#76 | 12.5%(-1.16)#13,703 |
| 77. | Swanton | 11.4% | 10.4%(+0.997)#77 | 12.5%(-1.11)#13,761 |
| 78. | Ascutney | 11.7% | 10.4%(+1.24)#78 | 12.5%(-0.868)#14,055 |
| 79. | Norwich | 12.0% | 10.4%(+1.61)#79 | 12.5%(-0.497)#14,504 |
| 80. | North Bennington | 12.1% | 10.4%(+1.63)#80 | 12.5%(-0.473)#14,533 |
| 81. | Bristol | 12.4% | 10.4%(+1.96)#81 | 12.5%(-0.145)#14,865 |
| 82. | Ludlow | 12.4% | 10.4%(+2.02)#82 | 12.5%(-0.092)#14,930 |
| 83. | Hardwick | 12.5% | 10.4%(+2.08)#83 | 12.5%(-0.025)#15,003 |
| 84. | Bradford | 13.0% | 10.4%(+2.55)#84 | 12.5%(+0.440)#15,480 |
| 85. | Sheffield | 13.4% | 10.4%(+2.98)#85 | 12.5%(+0.867)#15,933 |
| 86. | Danby | 13.5% | 10.4%(+3.06)#86 | 12.5%(+0.948)#16,018 |
| 87. | Island Pond | 13.7% | 10.4%(+3.28)#87 | 12.5%(+1.17)#16,239 |
| 88. | Benson | 13.8% | 10.4%(+3.37)#88 | 12.5%(+1.26)#16,325 |
| 89. | Saxtons River | 13.8% | 10.4%(+3.37)#89 | 12.5%(+1.26)#16,333 |
| 90. | Middlebury | 13.9% | 10.4%(+3.48)#90 | 12.5%(+1.37)#16,433 |
| 91. | Hartford | 14.0% | 10.4%(+3.56)#91 | 12.5%(+1.45)#16,497 |
| 92. | Lowell | 14.1% | 10.4%(+3.64)#92 | 12.5%(+1.54)#16,562 |
| 93. | East Dorset | 14.2% | 10.4%(+3.80)#93 | 12.5%(+1.69)#16,714 |
| 94. | Hartland | 14.2% | 10.4%(+3.81)#94 | 12.5%(+1.71)#16,724 |
| 95. | Rochester | 14.5% | 10.4%(+4.10)#95 | 12.5%(+1.99)#16,996 |
| 96. | Morrisville | 14.5% | 10.4%(+4.12)#96 | 12.5%(+2.01)#17,019 |
| 97. | Beecher Falls | 14.9% | 10.4%(+4.42)#97 | 12.5%(+2.32)#17,328 |
| 98. | Groton | 14.9% | 10.4%(+4.43)#98 | 12.5%(+2.33)#17,335 |
| 99. | Bennington | 15.0% | 10.4%(+4.54)#99 | 12.5%(+2.43)#17,430 |
| 100. | Rutland | 15.0% | 10.4%(+4.60)#100 | 12.5%(+2.49)#17,499 |
1
2Common Questions
What are the Top 10 Cities with the Lowest Poverty Level in Vermont?
Top 10 Cities with the Lowest Poverty Level in Vermont are:
#1
0.50%
#2
0.62%
#3
0.73%
#4
1.4%
#5
1.7%
#6
1.8%
#7
2.0%
#8
2.1%
#9
2.3%
#10
2.6%
What city has the Lowest Poverty Level in Vermont?
Westminster has the Lowest Poverty Level in Vermont with 0.50%.
What is the Poverty Level in the State of Vermont?
Poverty Level in Vermont is 10.4%.
What is the Poverty Level in the United States?
Poverty Level in the United States is 12.5%.