Cities with the Lowest Poverty Level in Massachusetts
RELATED REPORTS & OPTIONS
Lowest Poverty
Massachusetts
Compare Cities
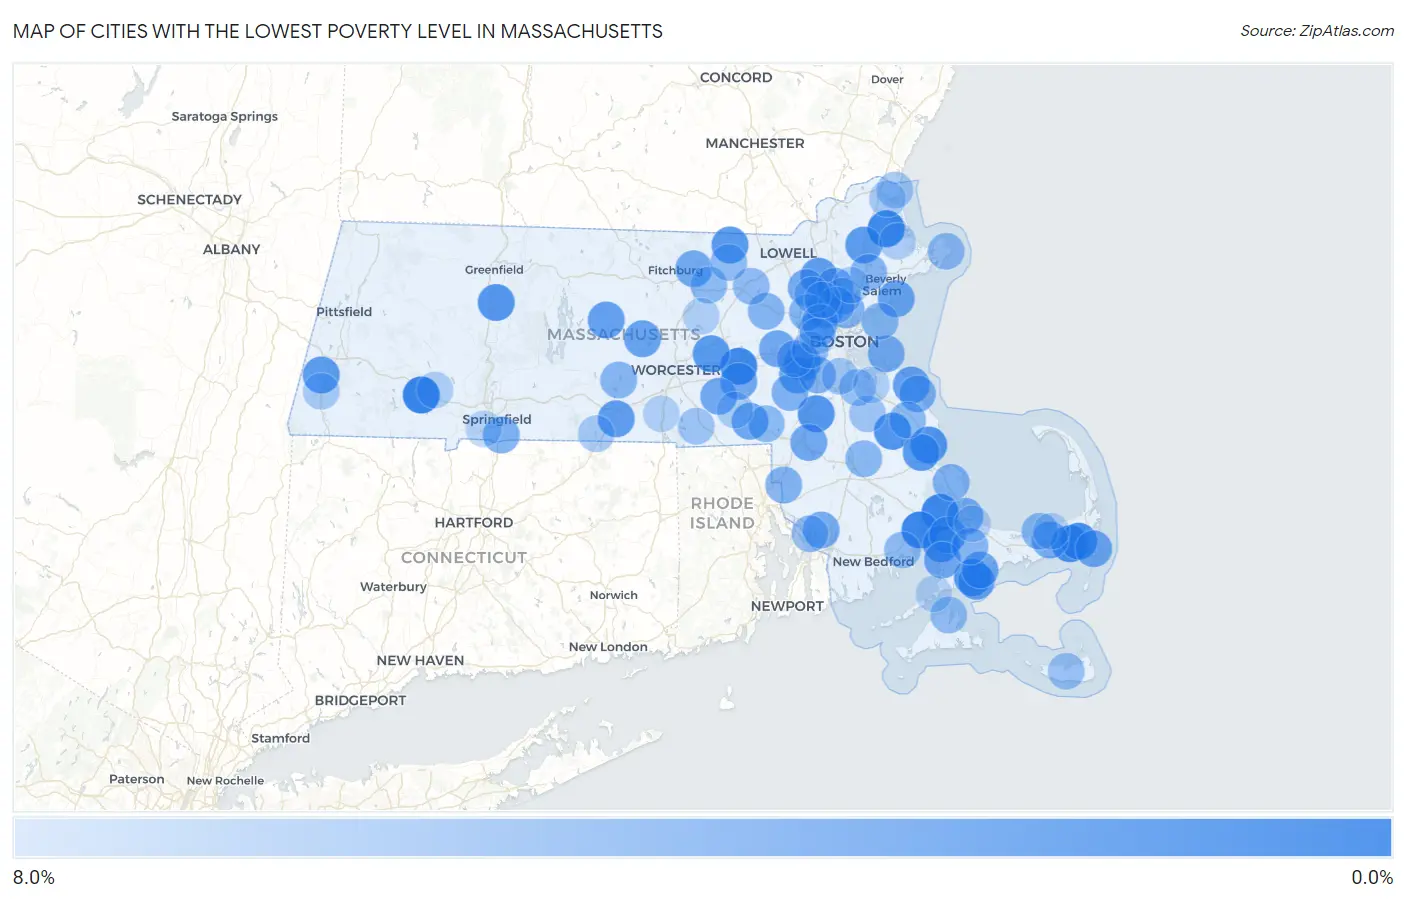
Map of Cities with the Lowest Poverty Level in Massachusetts
8.0%
0.0%
Cities with the Lowest Poverty Level in Massachusetts
| City | Poverty | vs State | vs National | |
| 1. | Blandford | 0.57% | 9.9%(-9.36)#1 | 12.5%(-12.0)#147 |
| 2. | White Island Shores | 0.76% | 9.9%(-9.16)#2 | 12.5%(-11.8)#235 |
| 3. | Weweantic | 0.82% | 9.9%(-9.11)#3 | 12.5%(-11.7)#270 |
| 4. | Cordaville | 0.94% | 9.9%(-8.99)#4 | 12.5%(-11.6)#327 |
| 5. | Rowley | 0.97% | 9.9%(-8.95)#5 | 12.5%(-11.6)#343 |
| 6. | Harwich Center | 1.4% | 9.9%(-8.57)#6 | 12.5%(-11.2)#599 |
| 7. | East Harwich | 1.4% | 9.9%(-8.52)#7 | 12.5%(-11.1)#641 |
| 8. | Seabrook | 1.5% | 9.9%(-8.39)#8 | 12.5%(-11.0)#733 |
| 9. | Hanson | 1.8% | 9.9%(-8.16)#9 | 12.5%(-10.8)#934 |
| 10. | Pocasset | 1.9% | 9.9%(-8.06)#10 | 12.5%(-10.7)#1,015 |
| 11. | South Deerfield | 2.0% | 9.9%(-7.97)#11 | 12.5%(-10.6)#1,096 |
| 12. | South Duxbury | 2.0% | 9.9%(-7.96)#12 | 12.5%(-10.6)#1,104 |
| 13. | Sharon | 2.0% | 9.9%(-7.94)#13 | 12.5%(-10.5)#1,128 |
| 14. | Kingston | 2.2% | 9.9%(-7.77)#14 | 12.5%(-10.4)#1,303 |
| 15. | Northborough | 2.2% | 9.9%(-7.76)#15 | 12.5%(-10.4)#1,311 |
| 16. | East Pepperell | 2.2% | 9.9%(-7.73)#16 | 12.5%(-10.3)#1,353 |
| 17. | Housatonic | 2.3% | 9.9%(-7.59)#17 | 12.5%(-10.2)#1,480 |
| 18. | Boxford | 2.4% | 9.9%(-7.57)#18 | 12.5%(-10.2)#1,511 |
| 19. | Cedar Crest | 2.4% | 9.9%(-7.57)#19 | 12.5%(-10.2)#1,513 |
| 20. | Sturbridge | 2.5% | 9.9%(-7.45)#20 | 12.5%(-10.1)#1,643 |
| 21. | Wilmington | 2.5% | 9.9%(-7.42)#21 | 12.5%(-10.0)#1,691 |
| 22. | North Scituate | 2.6% | 9.9%(-7.29)#22 | 12.5%(-9.90)#1,823 |
| 23. | Barre | 2.7% | 9.9%(-7.23)#23 | 12.5%(-9.84)#1,889 |
| 24. | Needham | 2.7% | 9.9%(-7.18)#24 | 12.5%(-9.79)#1,952 |
| 25. | New Seabury | 2.8% | 9.9%(-7.08)#25 | 12.5%(-9.69)#2,062 |
| 26. | Rutland | 2.9% | 9.9%(-7.07)#26 | 12.5%(-9.68)#2,069 |
| 27. | Monument Beach | 2.9% | 9.9%(-7.05)#27 | 12.5%(-9.66)#2,108 |
| 28. | Dover | 3.0% | 9.9%(-6.97)#28 | 12.5%(-9.58)#2,189 |
| 29. | Marblehead | 3.0% | 9.9%(-6.95)#29 | 12.5%(-9.56)#2,200 |
| 30. | Bellingham | 3.1% | 9.9%(-6.86)#30 | 12.5%(-9.47)#2,308 |
| 31. | North Falmouth | 3.2% | 9.9%(-6.77)#31 | 12.5%(-9.37)#2,415 |
| 32. | Mansfield Center | 3.2% | 9.9%(-6.71)#32 | 12.5%(-9.31)#2,507 |
| 33. | Hopkinton | 3.2% | 9.9%(-6.69)#33 | 12.5%(-9.29)#2,533 |
| 34. | Chatham | 3.3% | 9.9%(-6.66)#34 | 12.5%(-9.26)#2,566 |
| 35. | Cochituate | 3.3% | 9.9%(-6.64)#35 | 12.5%(-9.25)#2,599 |
| 36. | Upton | 3.3% | 9.9%(-6.63)#36 | 12.5%(-9.24)#2,609 |
| 37. | Mashpee Neck | 3.3% | 9.9%(-6.62)#37 | 12.5%(-9.23)#2,621 |
| 38. | Winchester | 3.3% | 9.9%(-6.58)#38 | 12.5%(-9.19)#2,683 |
| 39. | Lunenburg | 3.4% | 9.9%(-6.52)#39 | 12.5%(-9.13)#2,755 |
| 40. | Pinehurst | 3.5% | 9.9%(-6.41)#40 | 12.5%(-9.02)#2,919 |
| 41. | South Dennis | 3.5% | 9.9%(-6.41)#41 | 12.5%(-9.01)#2,925 |
| 42. | Reading | 3.5% | 9.9%(-6.39)#42 | 12.5%(-9.00)#2,952 |
| 43. | Sagamore | 3.6% | 9.9%(-6.35)#43 | 12.5%(-8.96)#3,020 |
| 44. | Hull | 3.6% | 9.9%(-6.33)#44 | 12.5%(-8.93)#3,057 |
| 45. | Somerset | 3.7% | 9.9%(-6.22)#45 | 12.5%(-8.82)#3,208 |
| 46. | Longmeadow | 3.8% | 9.9%(-6.09)#46 | 12.5%(-8.70)#3,362 |
| 47. | Belmont | 3.9% | 9.9%(-6.05)#47 | 12.5%(-8.65)#3,416 |
| 48. | Lenox Dale | 3.9% | 9.9%(-6.01)#48 | 12.5%(-8.61)#3,472 |
| 49. | Medfield | 3.9% | 9.9%(-5.98)#49 | 12.5%(-8.59)#3,508 |
| 50. | The Pinehills | 4.0% | 9.9%(-5.95)#50 | 12.5%(-8.56)#3,559 |
| 51. | Scituate | 4.0% | 9.9%(-5.94)#51 | 12.5%(-8.55)#3,567 |
| 52. | Melrose | 4.0% | 9.9%(-5.90)#52 | 12.5%(-8.50)#3,626 |
| 53. | North Seekonk | 4.1% | 9.9%(-5.86)#53 | 12.5%(-8.46)#3,683 |
| 54. | Dedham | 4.1% | 9.9%(-5.85)#54 | 12.5%(-8.46)#3,690 |
| 55. | Wellesley | 4.1% | 9.9%(-5.83)#55 | 12.5%(-8.43)#3,736 |
| 56. | Lexington | 4.2% | 9.9%(-5.77)#56 | 12.5%(-8.37)#3,802 |
| 57. | West Concord | 4.2% | 9.9%(-5.68)#57 | 12.5%(-8.29)#3,920 |
| 58. | Wakefield | 4.2% | 9.9%(-5.68)#58 | 12.5%(-8.29)#3,921 |
| 59. | Danvers | 4.3% | 9.9%(-5.60)#59 | 12.5%(-8.20)#4,025 |
| 60. | Forestdale | 4.4% | 9.9%(-5.55)#60 | 12.5%(-8.16)#4,086 |
| 61. | East Brookfield | 4.4% | 9.9%(-5.53)#61 | 12.5%(-8.14)#4,117 |
| 62. | Bridgewater Town | 4.4% | 9.9%(-5.51)#62 | 12.5%(-8.12)#4,143 |
| 63. | Dennis | 4.4% | 9.9%(-5.50)#63 | 12.5%(-8.11)#4,166 |
| 64. | North Pembroke | 4.5% | 9.9%(-5.39)#64 | 12.5%(-8.00)#4,326 |
| 65. | Shirley | 4.6% | 9.9%(-5.37)#65 | 12.5%(-7.97)#4,359 |
| 66. | Newton | 4.6% | 9.9%(-5.36)#66 | 12.5%(-7.97)#4,366 |
| 67. | Nahant | 4.6% | 9.9%(-5.34)#67 | 12.5%(-7.94)#4,391 |
| 68. | Franklin Town | 4.6% | 9.9%(-5.33)#68 | 12.5%(-7.93)#4,404 |
| 69. | Ocean Grove | 4.6% | 9.9%(-5.31)#69 | 12.5%(-7.92)#4,435 |
| 70. | Stoneham | 4.7% | 9.9%(-5.22)#70 | 12.5%(-7.82)#4,571 |
| 71. | Littleton Common | 4.7% | 9.9%(-5.19)#71 | 12.5%(-7.79)#4,603 |
| 72. | Mattapoisett Center | 4.8% | 9.9%(-5.16)#72 | 12.5%(-7.77)#4,640 |
| 73. | Rockport | 4.8% | 9.9%(-5.12)#73 | 12.5%(-7.73)#4,684 |
| 74. | Groton | 4.8% | 9.9%(-5.08)#74 | 12.5%(-7.69)#4,757 |
| 75. | Vineyard Haven | 4.9% | 9.9%(-5.07)#75 | 12.5%(-7.68)#4,772 |
| 76. | Braintree Town | 5.1% | 9.9%(-4.85)#76 | 12.5%(-7.46)#5,064 |
| 77. | Burlington | 5.2% | 9.9%(-4.69)#77 | 12.5%(-7.30)#5,270 |
| 78. | North Attleborough | 5.3% | 9.9%(-4.65)#78 | 12.5%(-7.26)#5,331 |
| 79. | Nantucket | 5.3% | 9.9%(-4.64)#79 | 12.5%(-7.25)#5,334 |
| 80. | East Douglas | 5.3% | 9.9%(-4.58)#80 | 12.5%(-7.19)#5,439 |
| 81. | Arlington | 5.4% | 9.9%(-4.50)#81 | 12.5%(-7.11)#5,568 |
| 82. | Milton | 5.5% | 9.9%(-4.47)#82 | 12.5%(-7.08)#5,615 |
| 83. | Abington | 5.5% | 9.9%(-4.46)#83 | 12.5%(-7.07)#5,629 |
| 84. | Salisbury | 5.6% | 9.9%(-4.35)#84 | 12.5%(-6.95)#5,792 |
| 85. | Holland | 5.8% | 9.9%(-4.14)#85 | 12.5%(-6.75)#6,082 |
| 86. | Great Barrington | 5.8% | 9.9%(-4.10)#86 | 12.5%(-6.70)#6,158 |
| 87. | Newburyport | 5.8% | 9.9%(-4.08)#87 | 12.5%(-6.69)#6,179 |
| 88. | Hopedale | 6.1% | 9.9%(-3.87)#88 | 12.5%(-6.48)#6,487 |
| 89. | Russell | 6.1% | 9.9%(-3.82)#89 | 12.5%(-6.43)#6,565 |
| 90. | Ipswich | 6.2% | 9.9%(-3.77)#90 | 12.5%(-6.38)#6,634 |
| 91. | Oxford | 6.2% | 9.9%(-3.72)#91 | 12.5%(-6.33)#6,695 |
| 92. | Weymouth Town | 6.3% | 9.9%(-3.67)#92 | 12.5%(-6.28)#6,794 |
| 93. | South Lancaster | 6.3% | 9.9%(-3.66)#93 | 12.5%(-6.26)#6,817 |
| 94. | Lynnfield | 6.3% | 9.9%(-3.64)#94 | 12.5%(-6.24)#6,848 |
| 95. | Sandwich | 6.4% | 9.9%(-3.55)#95 | 12.5%(-6.16)#6,960 |
| 96. | East Dennis | 6.4% | 9.9%(-3.54)#96 | 12.5%(-6.15)#6,985 |
| 97. | Watertown Town | 6.5% | 9.9%(-3.46)#97 | 12.5%(-6.06)#7,121 |
| 98. | Agawam Town | 6.5% | 9.9%(-3.42)#98 | 12.5%(-6.02)#7,172 |
| 99. | Woburn | 6.5% | 9.9%(-3.39)#99 | 12.5%(-6.00)#7,208 |
| 100. | Woods Hole | 6.6% | 9.9%(-3.38)#100 | 12.5%(-5.98)#7,227 |
Common Questions
What are the Top 10 Cities with the Lowest Poverty Level in Massachusetts?
Top 10 Cities with the Lowest Poverty Level in Massachusetts are:
#1
0.57%
#2
0.76%
#3
0.82%
#4
0.94%
#5
0.97%
#6
1.4%
#7
1.4%
#8
1.5%
#9
1.8%
#10
1.9%
What city has the Lowest Poverty Level in Massachusetts?
Blandford has the Lowest Poverty Level in Massachusetts with 0.57%.
What is the Poverty Level in the State of Massachusetts?
Poverty Level in Massachusetts is 9.9%.
What is the Poverty Level in the United States?
Poverty Level in the United States is 12.5%.