Cities with the Lowest Poverty Level in Connecticut
RELATED REPORTS & OPTIONS
Lowest Poverty
Connecticut
Compare Cities
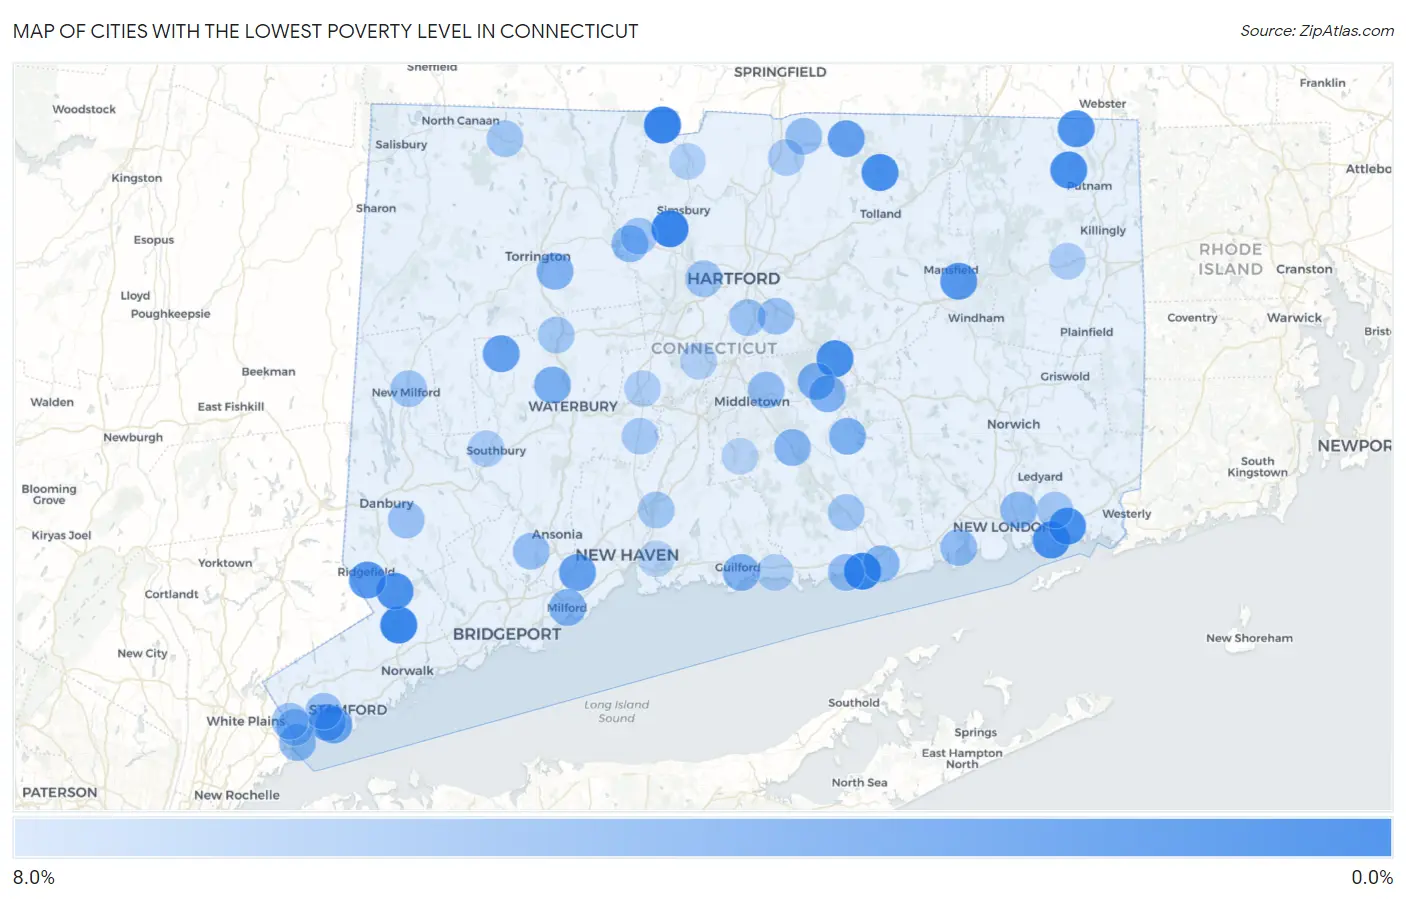
Map of Cities with the Lowest Poverty Level in Connecticut
8.0%
0.0%
Cities with the Lowest Poverty Level in Connecticut
| City | Poverty | vs State | vs National | |
| 1. | Weatogue | 0.11% | 10.1%(-10.0)#1 | 12.5%(-12.4)#9 |
| 2. | Weston | 0.13% | 10.1%(-10.0)#2 | 12.5%(-12.4)#10 |
| 3. | North Granby | 0.13% | 10.1%(-10.0)#3 | 12.5%(-12.4)#12 |
| 4. | Wilton Center | 0.19% | 10.1%(-9.96)#4 | 12.5%(-12.3)#18 |
| 5. | Saybrook Manor | 0.41% | 10.1%(-9.73)#5 | 12.5%(-12.1)#87 |
| 6. | East | 0.62% | 10.1%(-9.52)#6 | 12.5%(-11.9)#164 |
| 7. | Mill Plain | 0.71% | 10.1%(-9.43)#7 | 12.5%(-11.8)#207 |
| 8. | Lake Bungee | 0.78% | 10.1%(-9.36)#8 | 12.5%(-11.8)#244 |
| 9. | Noank | 1.1% | 10.1%(-9.08)#9 | 12.5%(-11.5)#384 |
| 10. | South Woodstock | 1.1% | 10.1%(-9.08)#10 | 12.5%(-11.5)#385 |
| 11. | Crystal Lake | 1.1% | 10.1%(-9.03)#11 | 12.5%(-11.4)#417 |
| 12. | Terramuggus | 1.2% | 10.1%(-8.98)#12 | 12.5%(-11.4)#459 |
| 13. | Mystic | 1.2% | 10.1%(-8.94)#13 | 12.5%(-11.3)#486 |
| 14. | Georgetown | 1.3% | 10.1%(-8.87)#14 | 12.5%(-11.3)#532 |
| 15. | Quinebaug | 1.5% | 10.1%(-8.66)#15 | 12.5%(-11.1)#688 |
| 16. | Saugatuck | 1.7% | 10.1%(-8.46)#16 | 12.5%(-10.9)#857 |
| 17. | Mansfield Center | 1.9% | 10.1%(-8.27)#17 | 12.5%(-10.7)#1,022 |
| 18. | Ridgefield | 1.9% | 10.1%(-8.25)#18 | 12.5%(-10.6)#1,037 |
| 19. | Lakes West | 1.9% | 10.1%(-8.23)#19 | 12.5%(-10.6)#1,056 |
| 20. | Mamanasco Lake | 2.1% | 10.1%(-8.01)#20 | 12.5%(-10.4)#1,268 |
| 21. | Westport | 2.2% | 10.1%(-7.97)#21 | 12.5%(-10.4)#1,312 |
| 22. | Mechanicsville | 2.2% | 10.1%(-7.93)#22 | 12.5%(-10.3)#1,362 |
| 23. | Gaylordsville | 2.2% | 10.1%(-7.91)#23 | 12.5%(-10.3)#1,383 |
| 24. | Newtown Borough | 2.2% | 10.1%(-7.89)#24 | 12.5%(-10.3)#1,392 |
| 25. | Candlewood Orchards | 2.3% | 10.1%(-7.85)#25 | 12.5%(-10.2)#1,434 |
| 26. | Bogus Hill | 2.3% | 10.1%(-7.83)#26 | 12.5%(-10.2)#1,456 |
| 27. | Poplar Plains | 2.5% | 10.1%(-7.62)#27 | 12.5%(-10.0)#1,698 |
| 28. | Somers | 2.6% | 10.1%(-7.50)#28 | 12.5%(-9.89)#1,830 |
| 29. | Orange | 2.7% | 10.1%(-7.40)#29 | 12.5%(-9.79)#1,945 |
| 30. | Old Hill | 2.8% | 10.1%(-7.38)#30 | 12.5%(-9.77)#1,967 |
| 31. | Bethlehem Village | 2.8% | 10.1%(-7.33)#31 | 12.5%(-9.73)#2,019 |
| 32. | Woodmont Borough | 2.8% | 10.1%(-7.30)#32 | 12.5%(-9.69)#2,054 |
| 33. | New Canaan | 2.9% | 10.1%(-7.29)#33 | 12.5%(-9.68)#2,066 |
| 34. | Old Greenwich | 3.1% | 10.1%(-7.07)#34 | 12.5%(-9.46)#2,316 |
| 35. | Riverside | 3.3% | 10.1%(-6.80)#35 | 12.5%(-9.19)#2,678 |
| 36. | Inglenook | 3.5% | 10.1%(-6.69)#36 | 12.5%(-9.08)#2,822 |
| 37. | Lake Pocotopaug | 3.7% | 10.1%(-6.47)#37 | 12.5%(-8.86)#3,156 |
| 38. | Northford | 3.8% | 10.1%(-6.34)#38 | 12.5%(-8.74)#3,305 |
| 39. | Greens Farms | 3.8% | 10.1%(-6.33)#39 | 12.5%(-8.72)#3,332 |
| 40. | Oakville | 3.9% | 10.1%(-6.22)#40 | 12.5%(-8.62)#3,467 |
| 41. | South Wilton | 3.9% | 10.1%(-6.22)#41 | 12.5%(-8.61)#3,470 |
| 42. | Hawleyville | 4.0% | 10.1%(-6.14)#42 | 12.5%(-8.53)#3,591 |
| 43. | Moodus | 4.0% | 10.1%(-6.10)#43 | 12.5%(-8.50)#3,632 |
| 44. | Darien Downtown | 4.1% | 10.1%(-6.06)#44 | 12.5%(-8.46)#3,697 |
| 45. | East Hampton | 4.3% | 10.1%(-5.88)#45 | 12.5%(-8.27)#3,936 |
| 46. | Northwest Harwinton | 4.4% | 10.1%(-5.78)#46 | 12.5%(-8.17)#4,065 |
| 47. | Guilford Center | 4.4% | 10.1%(-5.71)#47 | 12.5%(-8.10)#4,175 |
| 48. | Milford City Balance | 4.5% | 10.1%(-5.67)#48 | 12.5%(-8.06)#4,240 |
| 49. | Sandy Hook | 4.6% | 10.1%(-5.57)#49 | 12.5%(-7.96)#4,369 |
| 50. | Coleytown | 4.6% | 10.1%(-5.51)#50 | 12.5%(-7.90)#4,458 |
| 51. | Higganum | 4.7% | 10.1%(-5.42)#51 | 12.5%(-7.81)#4,583 |
| 52. | Byram | 4.8% | 10.1%(-5.37)#52 | 12.5%(-7.77)#4,643 |
| 53. | Riverton | 4.8% | 10.1%(-5.32)#53 | 12.5%(-7.72)#4,711 |
| 54. | Old Saybrook Center | 4.9% | 10.1%(-5.28)#54 | 12.5%(-7.68)#4,779 |
| 55. | Collinsville | 4.9% | 10.1%(-5.28)#55 | 12.5%(-7.67)#4,784 |
| 56. | Stepney | 5.0% | 10.1%(-5.19)#56 | 12.5%(-7.58)#4,893 |
| 57. | Conning Towers Nautilus Park | 5.1% | 10.1%(-5.05)#57 | 12.5%(-7.44)#5,081 |
| 58. | Niantic | 5.2% | 10.1%(-4.92)#58 | 12.5%(-7.31)#5,254 |
| 59. | Pemberwick | 5.3% | 10.1%(-4.88)#59 | 12.5%(-7.27)#5,301 |
| 60. | Ridgebury | 5.3% | 10.1%(-4.79)#60 | 12.5%(-7.18)#5,441 |
| 61. | Westbrook Center | 5.4% | 10.1%(-4.78)#61 | 12.5%(-7.18)#5,451 |
| 62. | Portland | 5.4% | 10.1%(-4.72)#62 | 12.5%(-7.11)#5,567 |
| 63. | Naugatuck Borough | 5.5% | 10.1%(-4.66)#63 | 12.5%(-7.05)#5,650 |
| 64. | Trumbull Center | 5.5% | 10.1%(-4.64)#64 | 12.5%(-7.04)#5,674 |
| 65. | Hazardville | 5.5% | 10.1%(-4.64)#65 | 12.5%(-7.03)#5,680 |
| 66. | Shelton | 5.5% | 10.1%(-4.61)#66 | 12.5%(-7.00)#5,715 |
| 67. | Tashua | 5.6% | 10.1%(-4.52)#67 | 12.5%(-6.91)#5,851 |
| 68. | Bethel | 5.6% | 10.1%(-4.52)#68 | 12.5%(-6.91)#5,852 |
| 69. | Cos Cob | 5.7% | 10.1%(-4.45)#69 | 12.5%(-6.84)#5,953 |
| 70. | Glastonbury Center | 5.8% | 10.1%(-4.39)#70 | 12.5%(-6.78)#6,034 |
| 71. | Glenville | 5.8% | 10.1%(-4.39)#71 | 12.5%(-6.78)#6,035 |
| 72. | Litchfield Borough | 5.8% | 10.1%(-4.29)#72 | 12.5%(-6.69)#6,177 |
| 73. | Wethersfield | 5.9% | 10.1%(-4.29)#73 | 12.5%(-6.68)#6,182 |
| 74. | West Hartford | 5.9% | 10.1%(-4.21)#74 | 12.5%(-6.60)#6,300 |
| 75. | Daniels Farm | 6.0% | 10.1%(-4.16)#75 | 12.5%(-6.56)#6,368 |
| 76. | New Milford | 6.0% | 10.1%(-4.10)#76 | 12.5%(-6.49)#6,474 |
| 77. | Route 7 Gateway | 6.0% | 10.1%(-4.09)#77 | 12.5%(-6.49)#6,479 |
| 78. | Canton Valley | 6.1% | 10.1%(-4.08)#78 | 12.5%(-6.47)#6,505 |
| 79. | Deep River Center | 6.1% | 10.1%(-4.06)#79 | 12.5%(-6.45)#6,525 |
| 80. | Plattsville | 6.2% | 10.1%(-3.98)#80 | 12.5%(-6.37)#6,640 |
| 81. | North Haven | 6.2% | 10.1%(-3.92)#81 | 12.5%(-6.32)#6,720 |
| 82. | Thomaston | 6.2% | 10.1%(-3.91)#82 | 12.5%(-6.30)#6,749 |
| 83. | Norfolk | 6.3% | 10.1%(-3.85)#83 | 12.5%(-6.25)#6,843 |
| 84. | Old Mystic | 6.3% | 10.1%(-3.85)#84 | 12.5%(-6.24)#6,851 |
| 85. | Cheshire Village | 6.5% | 10.1%(-3.65)#85 | 12.5%(-6.05)#7,136 |
| 86. | Noroton | 6.5% | 10.1%(-3.65)#86 | 12.5%(-6.04)#7,148 |
| 87. | Stonington Borough | 6.6% | 10.1%(-3.56)#87 | 12.5%(-5.95)#7,270 |
| 88. | Southwood Acres | 6.6% | 10.1%(-3.53)#88 | 12.5%(-5.93)#7,302 |
| 89. | Ball Pond | 6.6% | 10.1%(-3.53)#89 | 12.5%(-5.92)#7,311 |
| 90. | Stratford Downtown | 6.6% | 10.1%(-3.51)#90 | 12.5%(-5.90)#7,338 |
| 91. | Staples | 6.6% | 10.1%(-3.50)#91 | 12.5%(-5.89)#7,352 |
| 92. | Indian Field | 6.7% | 10.1%(-3.49)#92 | 12.5%(-5.88)#7,367 |
| 93. | Heritage Village | 6.7% | 10.1%(-3.46)#93 | 12.5%(-5.86)#7,419 |
| 94. | Brooklyn | 6.7% | 10.1%(-3.40)#94 | 12.5%(-5.80)#7,490 |
| 95. | Madison Center | 6.8% | 10.1%(-3.34)#95 | 12.5%(-5.74)#7,571 |
| 96. | Plantsville | 6.9% | 10.1%(-3.28)#96 | 12.5%(-5.67)#7,661 |
| 97. | Kensington | 7.0% | 10.1%(-3.13)#97 | 12.5%(-5.52)#7,899 |
| 98. | Salmon Brook | 7.0% | 10.1%(-3.11)#98 | 12.5%(-5.50)#7,933 |
| 99. | East Haven | 7.3% | 10.1%(-2.85)#99 | 12.5%(-5.25)#8,285 |
| 100. | Durham | 7.3% | 10.1%(-2.82)#100 | 12.5%(-5.21)#8,334 |
1
2Common Questions
What are the Top 10 Cities with the Lowest Poverty Level in Connecticut?
Top 10 Cities with the Lowest Poverty Level in Connecticut are:
#1
0.11%
#2
0.13%
#3
0.19%
#4
0.41%
#5
1.1%
#6
1.1%
#7
1.1%
#8
1.2%
#9
1.2%
#10
1.3%
What city has the Lowest Poverty Level in Connecticut?
Weatogue has the Lowest Poverty Level in Connecticut with 0.11%.
What is the Poverty Level in the State of Connecticut?
Poverty Level in Connecticut is 10.1%.
What is the Poverty Level in the United States?
Poverty Level in the United States is 12.5%.