Cities with the Lowest Poverty Level in Pennsylvania
RELATED REPORTS & OPTIONS
Lowest Poverty
Pennsylvania
Compare Cities
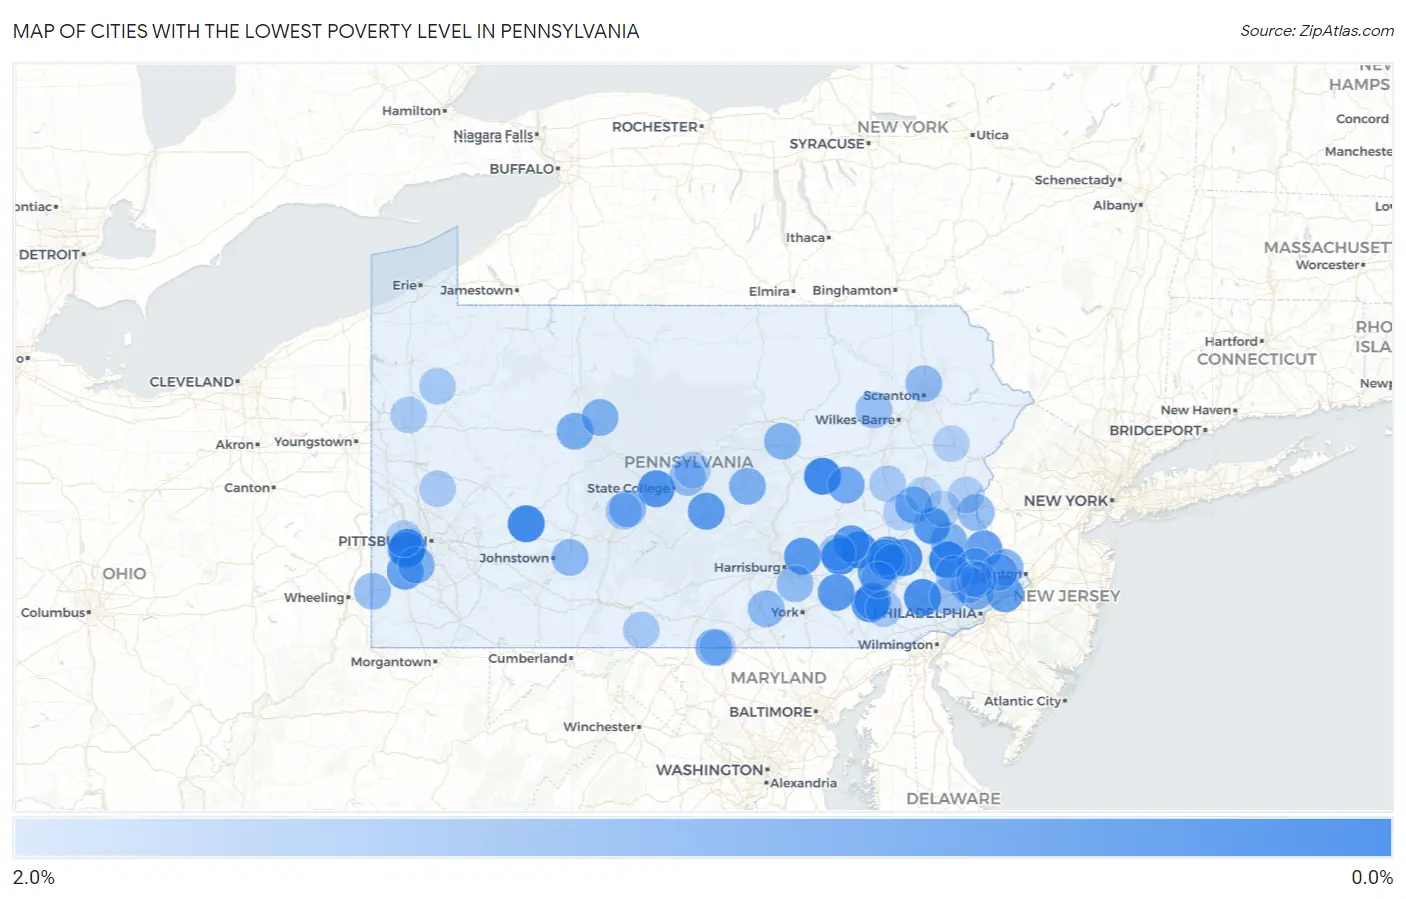
Map of Cities with the Lowest Poverty Level in Pennsylvania
2.0%
0.0%
Cities with the Lowest Poverty Level in Pennsylvania
| City | Poverty | vs State | vs National | |
| 1. | Woxall | 0.072% | 11.8%(-11.7)#1 | 12.5%(-12.5)#3 |
| 2. | Noblestown | 0.19% | 11.8%(-11.6)#2 | 12.5%(-12.3)#19 |
| 3. | Elysburg | 0.20% | 11.8%(-11.6)#3 | 12.5%(-12.3)#22 |
| 4. | Lucerne Mines | 0.23% | 11.8%(-11.6)#4 | 12.5%(-12.3)#30 |
| 5. | Hebron | 0.28% | 11.8%(-11.5)#5 | 12.5%(-12.3)#42 |
| 6. | Stouchsburg | 0.29% | 11.8%(-11.5)#6 | 12.5%(-12.2)#44 |
| 7. | Jacksonwald | 0.31% | 11.8%(-11.5)#7 | 12.5%(-12.2)#51 |
| 8. | Eagleview | 0.36% | 11.8%(-11.4)#8 | 12.5%(-12.2)#70 |
| 9. | Bethany Borough | 0.43% | 11.8%(-11.4)#9 | 12.5%(-12.1)#94 |
| 10. | Stormstown | 0.45% | 11.8%(-11.3)#10 | 12.5%(-12.1)#100 |
| 11. | Newtown Borough | 0.46% | 11.8%(-11.3)#11 | 12.5%(-12.1)#107 |
| 12. | Gordonville | 0.47% | 11.8%(-11.3)#12 | 12.5%(-12.1)#110 |
| 13. | Penn Lake Park Borough | 0.55% | 11.8%(-11.2)#13 | 12.5%(-12.0)#132 |
| 14. | Jeddo Borough | 0.56% | 11.8%(-11.2)#14 | 12.5%(-12.0)#139 |
| 15. | Skyline View | 0.57% | 11.8%(-11.2)#15 | 12.5%(-12.0)#148 |
| 16. | Colony Park | 0.57% | 11.8%(-11.2)#16 | 12.5%(-12.0)#149 |
| 17. | Salunga | 0.58% | 11.8%(-11.2)#17 | 12.5%(-12.0)#151 |
| 18. | Mount Aetna | 0.64% | 11.8%(-11.1)#18 | 12.5%(-11.9)#178 |
| 19. | Yeagertown | 0.66% | 11.8%(-11.1)#19 | 12.5%(-11.9)#188 |
| 20. | Intercourse | 0.71% | 11.8%(-11.1)#20 | 12.5%(-11.8)#210 |
| 21. | Swartzville | 0.71% | 11.8%(-11.1)#21 | 12.5%(-11.8)#212 |
| 22. | Montrose Manor | 0.71% | 11.8%(-11.1)#22 | 12.5%(-11.8)#216 |
| 23. | Loop | 0.72% | 11.8%(-11.1)#23 | 12.5%(-11.8)#219 |
| 24. | Eddington | 0.73% | 11.8%(-11.1)#24 | 12.5%(-11.8)#221 |
| 25. | Manor Borough | 0.73% | 11.8%(-11.0)#25 | 12.5%(-11.8)#224 |
| 26. | Laporte Borough | 0.74% | 11.8%(-11.0)#26 | 12.5%(-11.8)#225 |
| 27. | Silverdale Borough | 0.79% | 11.8%(-11.0)#27 | 12.5%(-11.7)#249 |
| 28. | Plumsteadville | 0.82% | 11.8%(-11.0)#28 | 12.5%(-11.7)#272 |
| 29. | Chest Springs Borough | 0.85% | 11.8%(-10.9)#29 | 12.5%(-11.7)#284 |
| 30. | Mcgovern | 0.86% | 11.8%(-10.9)#30 | 12.5%(-11.7)#291 |
| 31. | Sturgeon | 0.92% | 11.8%(-10.9)#31 | 12.5%(-11.6)#318 |
| 32. | Ben Avon Heights Borough | 0.96% | 11.8%(-10.8)#32 | 12.5%(-11.6)#335 |
| 33. | Rosslyn Farms Borough | 0.97% | 11.8%(-10.8)#33 | 12.5%(-11.6)#341 |
| 34. | Aristes | 1.0% | 11.8%(-10.8)#34 | 12.5%(-11.5)#365 |
| 35. | New Tripoli | 1.0% | 11.8%(-10.8)#35 | 12.5%(-11.5)#371 |
| 36. | Flourtown | 1.1% | 11.8%(-10.7)#36 | 12.5%(-11.5)#392 |
| 37. | Treasure Lake | 1.1% | 11.8%(-10.7)#37 | 12.5%(-11.4)#414 |
| 38. | Pen Mar | 1.1% | 11.8%(-10.7)#38 | 12.5%(-11.4)#415 |
| 39. | Callery Borough | 1.1% | 11.8%(-10.7)#39 | 12.5%(-11.4)#432 |
| 40. | Armagh Borough | 1.1% | 11.8%(-10.6)#40 | 12.5%(-11.4)#443 |
| 41. | Thompsonville | 1.1% | 11.8%(-10.6)#41 | 12.5%(-11.4)#445 |
| 42. | Fox Chapel Borough | 1.2% | 11.8%(-10.6)#42 | 12.5%(-11.4)#452 |
| 43. | Rutledge Borough | 1.2% | 11.8%(-10.6)#43 | 12.5%(-11.4)#467 |
| 44. | Troxelville | 1.2% | 11.8%(-10.6)#44 | 12.5%(-11.4)#473 |
| 45. | Newtown Grant | 1.2% | 11.8%(-10.6)#45 | 12.5%(-11.4)#475 |
| 46. | Edgeworth Borough | 1.2% | 11.8%(-10.6)#46 | 12.5%(-11.4)#476 |
| 47. | Volant Borough | 1.2% | 11.8%(-10.6)#47 | 12.5%(-11.3)#479 |
| 48. | Force | 1.2% | 11.8%(-10.6)#48 | 12.5%(-11.3)#482 |
| 49. | Brittany Farms The Highlands | 1.2% | 11.8%(-10.6)#49 | 12.5%(-11.3)#495 |
| 50. | Spinnerstown | 1.2% | 11.8%(-10.6)#50 | 12.5%(-11.3)#502 |
| 51. | Dilworthtown | 1.2% | 11.8%(-10.5)#51 | 12.5%(-11.3)#510 |
| 52. | Trexlertown | 1.3% | 11.8%(-10.5)#52 | 12.5%(-11.3)#523 |
| 53. | Springmont | 1.3% | 11.8%(-10.5)#53 | 12.5%(-11.3)#525 |
| 54. | Grazierville | 1.3% | 11.8%(-10.5)#54 | 12.5%(-11.3)#535 |
| 55. | Allenwood | 1.3% | 11.8%(-10.5)#55 | 12.5%(-11.3)#541 |
| 56. | Tatamy Borough | 1.3% | 11.8%(-10.5)#56 | 12.5%(-11.2)#569 |
| 57. | Lake Meade | 1.4% | 11.8%(-10.4)#57 | 12.5%(-11.2)#600 |
| 58. | Richboro | 1.4% | 11.8%(-10.4)#58 | 12.5%(-11.1)#626 |
| 59. | St Michael | 1.4% | 11.8%(-10.4)#59 | 12.5%(-11.1)#627 |
| 60. | Blue Bell | 1.4% | 11.8%(-10.4)#60 | 12.5%(-11.1)#628 |
| 61. | Raubsville | 1.4% | 11.8%(-10.4)#61 | 12.5%(-11.1)#634 |
| 62. | Chinchilla | 1.4% | 11.8%(-10.4)#62 | 12.5%(-11.1)#645 |
| 63. | West Alexander | 1.4% | 11.8%(-10.4)#63 | 12.5%(-11.1)#658 |
| 64. | Sewickley Hills Borough | 1.4% | 11.8%(-10.3)#64 | 12.5%(-11.1)#664 |
| 65. | Valley Green | 1.4% | 11.8%(-10.3)#65 | 12.5%(-11.1)#669 |
| 66. | Pleasant Gap | 1.4% | 11.8%(-10.3)#66 | 12.5%(-11.1)#670 |
| 67. | Ancient Oaks | 1.5% | 11.8%(-10.3)#67 | 12.5%(-11.1)#680 |
| 68. | Snydertown Borough | 1.5% | 11.8%(-10.3)#68 | 12.5%(-11.1)#687 |
| 69. | Pikes Creek | 1.5% | 11.8%(-10.2)#69 | 12.5%(-11.0)#737 |
| 70. | Chesterbrook | 1.5% | 11.8%(-10.2)#70 | 12.5%(-11.0)#747 |
| 71. | Clarks Green Borough | 1.6% | 11.8%(-10.2)#71 | 12.5%(-11.0)#772 |
| 72. | Yardley Borough | 1.6% | 11.8%(-10.2)#72 | 12.5%(-11.0)#773 |
| 73. | Birmingham Borough | 1.6% | 11.8%(-10.2)#73 | 12.5%(-10.9)#779 |
| 74. | Conyngham Borough | 1.6% | 11.8%(-10.2)#74 | 12.5%(-10.9)#780 |
| 75. | Haysville Borough | 1.6% | 11.8%(-10.2)#75 | 12.5%(-10.9)#800 |
| 76. | Skippack | 1.7% | 11.8%(-10.1)#76 | 12.5%(-10.9)#842 |
| 77. | Aspinwall Borough | 1.7% | 11.8%(-10.1)#77 | 12.5%(-10.9)#843 |
| 78. | Gap | 1.7% | 11.8%(-10.1)#78 | 12.5%(-10.9)#859 |
| 79. | Worthville Borough | 1.7% | 11.8%(-10.1)#79 | 12.5%(-10.8)#870 |
| 80. | Tipton | 1.7% | 11.8%(-10.0)#80 | 12.5%(-10.8)#902 |
| 81. | Sand Hill | 1.7% | 11.8%(-10.0)#81 | 12.5%(-10.8)#912 |
| 82. | Hannasville | 1.8% | 11.8%(-10.0)#82 | 12.5%(-10.8)#935 |
| 83. | Needmore | 1.8% | 11.8%(-10.00)#83 | 12.5%(-10.7)#942 |
| 84. | Zion | 1.8% | 11.8%(-9.98)#84 | 12.5%(-10.7)#960 |
| 85. | Hometown | 1.8% | 11.8%(-9.97)#85 | 12.5%(-10.7)#962 |
| 86. | Lake Latonka | 1.8% | 11.8%(-9.97)#86 | 12.5%(-10.7)#963 |
| 87. | Nixon | 1.8% | 11.8%(-9.96)#87 | 12.5%(-10.7)#974 |
| 88. | Enlow | 1.8% | 11.8%(-9.96)#88 | 12.5%(-10.7)#978 |
| 89. | Eastlawn Gardens | 1.9% | 11.8%(-9.92)#89 | 12.5%(-10.7)#1,009 |
| 90. | Laurel Mountain Borough | 1.9% | 11.8%(-9.90)#90 | 12.5%(-10.6)#1,032 |
| 91. | Kempton | 1.9% | 11.8%(-9.88)#91 | 12.5%(-10.6)#1,041 |
| 92. | Maple Glen | 1.9% | 11.8%(-9.86)#92 | 12.5%(-10.6)#1,057 |
| 93. | Grill | 1.9% | 11.8%(-9.85)#93 | 12.5%(-10.6)#1,072 |
| 94. | Fivepointville | 1.9% | 11.8%(-9.85)#94 | 12.5%(-10.6)#1,074 |
| 95. | Spring House | 1.9% | 11.8%(-9.84)#95 | 12.5%(-10.6)#1,078 |
| 96. | Blue Ridge Summit | 1.9% | 11.8%(-9.84)#96 | 12.5%(-10.6)#1,079 |
| 97. | Bradford Woods Borough | 1.9% | 11.8%(-9.84)#97 | 12.5%(-10.6)#1,085 |
| 98. | Emerald Lakes | 2.0% | 11.8%(-9.83)#98 | 12.5%(-10.6)#1,090 |
| 99. | Hokendauqua | 2.0% | 11.8%(-9.82)#99 | 12.5%(-10.6)#1,095 |
| 100. | Slatedale | 2.0% | 11.8%(-9.78)#100 | 12.5%(-10.5)#1,133 |
Common Questions
What are the Top 10 Cities with the Lowest Poverty Level in Pennsylvania?
Top 10 Cities with the Lowest Poverty Level in Pennsylvania are:
#1
0.072%
#2
0.19%
#3
0.20%
#4
0.23%
#5
0.28%
#6
0.29%
#7
0.31%
#8
0.36%
#9
0.45%
#10
0.47%
What city has the Lowest Poverty Level in Pennsylvania?
Woxall has the Lowest Poverty Level in Pennsylvania with 0.072%.
What is the Poverty Level in the State of Pennsylvania?
Poverty Level in Pennsylvania is 11.8%.
What is the Poverty Level in the United States?
Poverty Level in the United States is 12.5%.