Cities with the Lowest Poverty Level in the United States
RELATED REPORTS & OPTIONS
Lowest Poverty
United States
Compare Cities
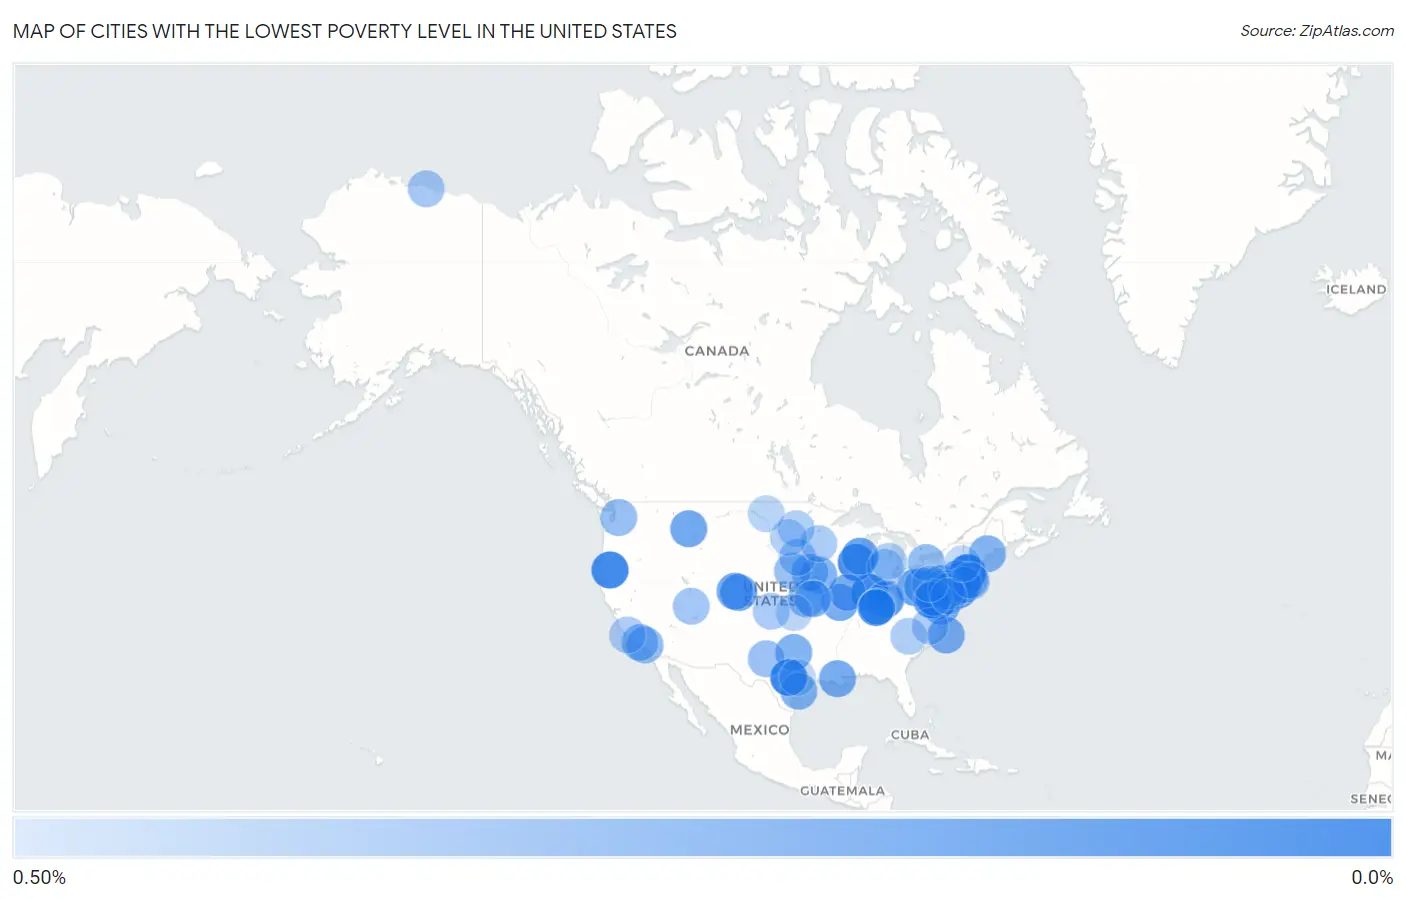
Map of Cities with the Lowest Poverty Level in the United States
0.50%
0.0%
Cities with the Lowest Poverty Level in the United States
| City | Poverty | vs State | vs National | |
| 1. | Pittsboro | 0.052% | 12.3%(-12.3)#1 | 12.5%(-12.5)#1 |
| 2. | Ho Ho Kus Borough | 0.071% | 9.7%(-9.61)#1 | 12.5%(-12.5)#2 |
| 3. | Woxall | 0.072% | 11.8%(-11.7)#1 | 12.5%(-12.5)#3 |
| 4. | Ruch | 0.073% | 11.9%(-11.8)#1 | 12.5%(-12.5)#4 |
| 5. | Nashotah | 0.083% | 10.7%(-10.6)#1 | 12.5%(-12.5)#5 |
| 6. | Cabin John | 0.091% | 9.3%(-9.17)#1 | 12.5%(-12.4)#6 |
| 7. | Fulton | 0.093% | 9.3%(-9.16)#2 | 12.5%(-12.4)#7 |
| 8. | Manchaca | 0.098% | 13.9%(-13.8)#1 | 12.5%(-12.4)#8 |
| 9. | Weatogue | 0.11% | 10.1%(-10.0)#1 | 12.5%(-12.4)#9 |
| 10. | Weston | 0.13% | 10.1%(-10.0)#2 | 12.5%(-12.4)#10 |
| 11. | Braddock | 0.13% | 10.0%(-9.86)#1 | 12.5%(-12.4)#11 |
| 12. | North Granby | 0.13% | 10.1%(-10.0)#3 | 12.5%(-12.4)#12 |
| 13. | Hopelawn | 0.14% | 9.7%(-9.54)#2 | 12.5%(-12.4)#13 |
| 14. | Chevy Chase Village | 0.16% | 9.3%(-9.10)#3 | 12.5%(-12.4)#14 |
| 15. | Baxter Estates | 0.17% | 13.6%(-13.4)#1 | 12.5%(-12.4)#15 |
| 16. | West Belmar | 0.18% | 9.7%(-9.51)#3 | 12.5%(-12.4)#16 |
| 17. | Griggstown | 0.18% | 9.7%(-9.50)#4 | 12.5%(-12.4)#17 |
| 18. | Wilton Center | 0.19% | 10.1%(-9.96)#4 | 12.5%(-12.3)#18 |
| 19. | Noblestown | 0.19% | 11.8%(-11.6)#2 | 12.5%(-12.3)#19 |
| 20. | Gibbsville | 0.19% | 10.7%(-10.5)#2 | 12.5%(-12.3)#20 |
| 21. | Todd Creek | 0.20% | 9.6%(-9.36)#1 | 12.5%(-12.3)#21 |
| 22. | Elysburg | 0.20% | 11.8%(-11.6)#3 | 12.5%(-12.3)#22 |
| 23. | Strathmoor Manor | 0.21% | 16.1%(-15.9)#1 | 12.5%(-12.3)#23 |
| 24. | Clancy | 0.21% | 12.4%(-12.2)#1 | 12.5%(-12.3)#24 |
| 25. | Beesleys Point | 0.21% | 9.7%(-9.47)#5 | 12.5%(-12.3)#25 |
| 26. | St Ann Highlands | 0.22% | 9.6%(-9.33)#2 | 12.5%(-12.3)#26 |
| 27. | St Paul | 0.22% | 12.8%(-12.6)#1 | 12.5%(-12.3)#27 |
| 28. | Sherman | 0.22% | 11.8%(-11.5)#1 | 12.5%(-12.3)#28 |
| 29. | Paincourtville | 0.23% | 18.7%(-18.4)#1 | 12.5%(-12.3)#29 |
| 30. | Lucerne Mines | 0.23% | 11.8%(-11.6)#4 | 12.5%(-12.3)#30 |
| 31. | Long Beach | 0.23% | 9.3%(-9.03)#4 | 12.5%(-12.3)#31 |
| 32. | Hatteras | 0.23% | 13.3%(-13.1)#1 | 12.5%(-12.3)#32 |
| 33. | East Rocky Hill | 0.24% | 9.7%(-9.44)#6 | 12.5%(-12.3)#33 |
| 34. | Chevy Chase Section Five | 0.25% | 9.3%(-9.01)#5 | 12.5%(-12.3)#34 |
| 35. | Port O Connor | 0.25% | 13.9%(-13.7)#2 | 12.5%(-12.3)#35 |
| 36. | Moorefield | 0.25% | 10.0%(-9.73)#2 | 12.5%(-12.3)#36 |
| 37. | Argyle | 0.26% | 13.9%(-13.7)#3 | 12.5%(-12.3)#37 |
| 38. | Bowdoinham | 0.26% | 10.9%(-10.7)#1 | 12.5%(-12.3)#38 |
| 39. | Alleman | 0.26% | 11.1%(-10.8)#1 | 12.5%(-12.3)#39 |
| 40. | Springfield | 0.27% | 9.7%(-9.41)#7 | 12.5%(-12.3)#40 |
| 41. | Loveland Park | 0.27% | 13.3%(-13.0)#1 | 12.5%(-12.3)#41 |
| 42. | Hebron | 0.28% | 11.8%(-11.5)#5 | 12.5%(-12.3)#42 |
| 43. | Floyds Knobs | 0.28% | 12.3%(-12.0)#2 | 12.5%(-12.3)#43 |
| 44. | Stouchsburg | 0.29% | 11.8%(-11.5)#6 | 12.5%(-12.2)#44 |
| 45. | North Caldwell Borough | 0.29% | 9.7%(-9.39)#8 | 12.5%(-12.2)#45 |
| 46. | Walton Park | 0.29% | 13.6%(-13.3)#2 | 12.5%(-12.2)#46 |
| 47. | Halbur | 0.30% | 11.1%(-10.8)#2 | 12.5%(-12.2)#47 |
| 48. | Hamilton | 0.30% | 10.0%(-9.69)#3 | 12.5%(-12.2)#48 |
| 49. | Ozawkie | 0.30% | 11.6%(-11.3)#1 | 12.5%(-12.2)#49 |
| 50. | Vernon | 0.30% | 12.1%(-11.8)#1 | 12.5%(-12.2)#50 |
| 51. | Jacksonwald | 0.31% | 11.8%(-11.5)#7 | 12.5%(-12.2)#51 |
| 52. | Clarence Center | 0.31% | 13.6%(-13.3)#3 | 12.5%(-12.2)#52 |
| 53. | Shelter Island | 0.31% | 13.6%(-13.3)#4 | 12.5%(-12.2)#53 |
| 54. | Snoqualmie | 0.31% | 9.9%(-9.58)#1 | 12.5%(-12.2)#54 |
| 55. | Hewitt | 0.31% | 9.7%(-9.37)#9 | 12.5%(-12.2)#55 |
| 56. | Santa Rosa Valley | 0.32% | 12.1%(-11.8)#2 | 12.5%(-12.2)#56 |
| 57. | Neshanic Station | 0.32% | 9.7%(-9.36)#10 | 12.5%(-12.2)#57 |
| 58. | Shenandoah Retreat | 0.32% | 10.0%(-9.66)#4 | 12.5%(-12.2)#58 |
| 59. | Hadar | 0.32% | 10.4%(-10.1)#1 | 12.5%(-12.2)#59 |
| 60. | Stepping Stone | 0.33% | 9.6%(-9.23)#3 | 12.5%(-12.2)#60 |
| 61. | Turpin Hills | 0.33% | 13.3%(-13.0)#2 | 12.5%(-12.2)#61 |
| 62. | Westbrook | 0.33% | 13.9%(-13.6)#4 | 12.5%(-12.2)#62 |
| 63. | Loa | 0.35% | 8.5%(-8.17)#1 | 12.5%(-12.2)#63 |
| 64. | Clear Lake Cdp Pierce County | 0.35% | 9.9%(-9.55)#2 | 12.5%(-12.2)#64 |
| 65. | Brightwaters | 0.35% | 13.6%(-13.3)#5 | 12.5%(-12.2)#65 |
| 66. | Pine Lakes Addition | 0.35% | 12.3%(-11.9)#1 | 12.5%(-12.2)#66 |
| 67. | Medford Lakes Borough | 0.35% | 9.7%(-9.33)#11 | 12.5%(-12.2)#67 |
| 68. | Prudhoe Bay | 0.35% | 10.5%(-10.1)#1 | 12.5%(-12.2)#68 |
| 69. | Navy | 0.36% | 10.0%(-9.63)#5 | 12.5%(-12.2)#69 |
| 70. | Eagleview | 0.36% | 11.8%(-11.4)#8 | 12.5%(-12.2)#70 |
| 71. | Ingalls | 0.36% | 11.6%(-11.2)#2 | 12.5%(-12.2)#71 |
| 72. | Glenaire | 0.37% | 12.8%(-12.5)#2 | 12.5%(-12.2)#72 |
| 73. | Sharon Center | 0.37% | 13.3%(-12.9)#3 | 12.5%(-12.2)#73 |
| 74. | Floyd | 0.37% | 16.2%(-15.9)#1 | 12.5%(-12.2)#74 |
| 75. | Independence | 0.38% | 9.3%(-8.89)#1 | 12.5%(-12.2)#75 |
| 76. | Dansville | 0.38% | 13.1%(-12.8)#1 | 12.5%(-12.2)#76 |
| 77. | Los Ranchos | 0.38% | 12.1%(-11.7)#3 | 12.5%(-12.2)#77 |
| 78. | Tega Cay | 0.38% | 14.4%(-14.0)#1 | 12.5%(-12.2)#78 |
| 79. | Centerville | 0.38% | 13.3%(-12.9)#2 | 12.5%(-12.2)#79 |
| 80. | Colfax | 0.39% | 10.8%(-10.4)#1 | 12.5%(-12.1)#80 |
| 81. | Fripp Island | 0.39% | 14.4%(-14.0)#2 | 12.5%(-12.1)#81 |
| 82. | Rolling Fields | 0.39% | 16.1%(-15.7)#2 | 12.5%(-12.1)#82 |
| 83. | Burt | 0.39% | 13.1%(-12.7)#2 | 12.5%(-12.1)#83 |
| 84. | Oakwood Park | 0.40% | 12.8%(-12.4)#3 | 12.5%(-12.1)#84 |
| 85. | Riverwood | 0.40% | 16.1%(-15.7)#3 | 12.5%(-12.1)#85 |
| 86. | Langford | 0.40% | 12.3%(-11.9)#2 | 12.5%(-12.1)#86 |
| 87. | Saybrook Manor | 0.41% | 10.1%(-9.73)#5 | 12.5%(-12.1)#87 |
| 88. | Benedict | 0.41% | 10.8%(-10.4)#2 | 12.5%(-12.1)#88 |
| 89. | Bear Creek | 0.41% | 13.9%(-13.5)#5 | 12.5%(-12.1)#89 |
| 90. | Buckner | 0.42% | 16.1%(-15.7)#4 | 12.5%(-12.1)#90 |
| 91. | Adamstown | 0.42% | 9.3%(-8.84)#6 | 12.5%(-12.1)#91 |
| 92. | Eastborough | 0.42% | 11.6%(-11.2)#3 | 12.5%(-12.1)#92 |
| 93. | Bellewood | 0.43% | 16.1%(-15.7)#5 | 12.5%(-12.1)#95 |
| 94. | New Munster | 0.43% | 10.7%(-10.2)#3 | 12.5%(-12.1)#96 |
| 95. | Bethany Borough | 0.43% | 11.8%(-11.4)#9 | 12.5%(-12.1)#97 |
| 96. | Alloway | 0.43% | 9.7%(-9.26)#12 | 12.5%(-12.1)#98 |
| 97. | Carmine | 0.43% | 13.9%(-13.5)#6 | 12.5%(-12.1)#99 |
| 98. | Valley Falls | 0.43% | 13.6%(-13.2)#6 | 12.5%(-12.1)#100 |
| 99. | Ida | 0.44% | 13.1%(-12.7)#3 | 12.5%(-12.1)#101 |
| 100. | Stormstown | 0.45% | 11.8%(-11.3)#10 | 12.5%(-12.1)#102 |
Common Questions
What are the Top 10 Cities with the Lowest Poverty Level in the United States?
Top 10 Cities with the Lowest Poverty Level in the United States are:
What city has the Lowest Poverty Level in the United States?
Pittsboro has the Lowest Poverty Level in the United States with 0.052%.
What is the Poverty Level in the United States?
Poverty Level in the United States is 12.5%.