Cities with the Lowest Poverty Level in Virginia
RELATED REPORTS & OPTIONS
Lowest Poverty
Virginia
Compare Cities
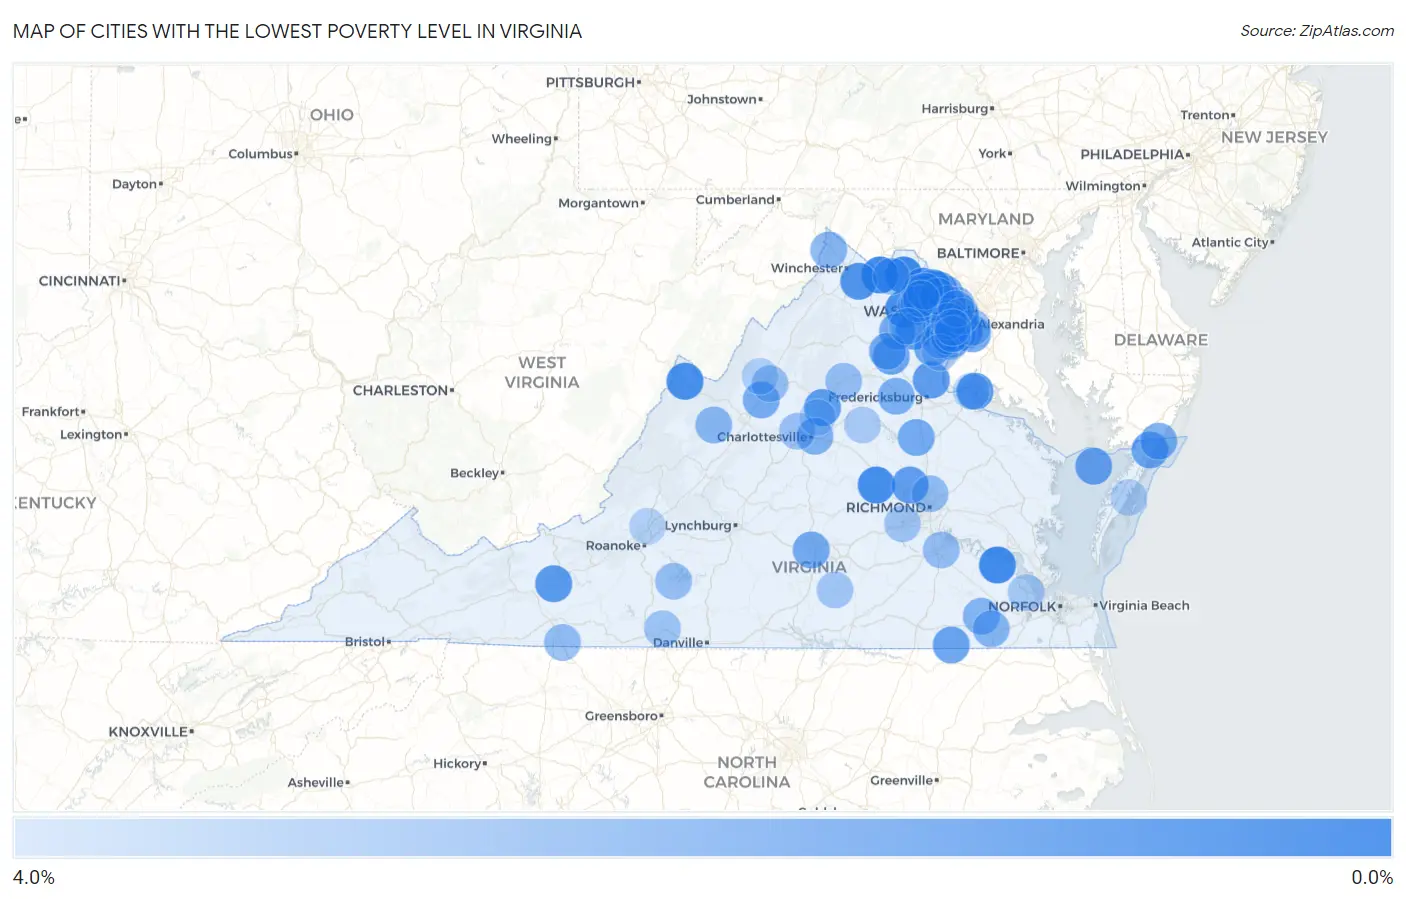
Map of Cities with the Lowest Poverty Level in Virginia
4.0%
0.0%
Cities with the Lowest Poverty Level in Virginia
| City | Poverty | vs State | vs National | |
| 1. | Braddock | 0.13% | 10.0%(-9.86)#1 | 12.5%(-12.4)#11 |
| 2. | Moorefield | 0.25% | 10.0%(-9.73)#2 | 12.5%(-12.3)#36 |
| 3. | Hamilton | 0.30% | 10.0%(-9.69)#3 | 12.5%(-12.2)#48 |
| 4. | Shenandoah Retreat | 0.32% | 10.0%(-9.66)#4 | 12.5%(-12.2)#58 |
| 5. | Navy | 0.36% | 10.0%(-9.63)#5 | 12.5%(-12.2)#69 |
| 6. | Surry | 0.45% | 10.0%(-9.53)#6 | 12.5%(-12.1)#103 |
| 7. | Lowes Island | 0.47% | 10.0%(-9.51)#7 | 12.5%(-12.1)#114 |
| 8. | Goochland | 0.52% | 10.0%(-9.46)#8 | 12.5%(-12.0)#128 |
| 9. | Monterey | 0.61% | 10.0%(-9.37)#9 | 12.5%(-11.9)#159 |
| 10. | Ravensworth | 0.64% | 10.0%(-9.35)#10 | 12.5%(-11.9)#176 |
| 11. | Bull Run Mountain Estates | 0.66% | 10.0%(-9.33)#11 | 12.5%(-11.9)#187 |
| 12. | One Loudoun | 0.76% | 10.0%(-9.23)#12 | 12.5%(-11.8)#234 |
| 13. | Difficult Run | 0.82% | 10.0%(-9.17)#13 | 12.5%(-11.7)#271 |
| 14. | South Run | 0.84% | 10.0%(-9.15)#14 | 12.5%(-11.7)#277 |
| 15. | Boyce | 0.84% | 10.0%(-9.15)#15 | 12.5%(-11.7)#278 |
| 16. | Stone Ridge | 0.94% | 10.0%(-9.04)#16 | 12.5%(-11.6)#329 |
| 17. | Dahlgren Center | 1.0% | 10.0%(-8.97)#17 | 12.5%(-11.5)#366 |
| 18. | Belmont | 1.0% | 10.0%(-8.95)#18 | 12.5%(-11.5)#373 |
| 19. | Hayfield | 1.1% | 10.0%(-8.93)#19 | 12.5%(-11.5)#383 |
| 20. | Linville | 1.1% | 10.0%(-8.90)#20 | 12.5%(-11.5)#397 |
| 21. | Draper | 1.1% | 10.0%(-8.85)#21 | 12.5%(-11.4)#439 |
| 22. | Ruckersville | 1.2% | 10.0%(-8.81)#22 | 12.5%(-11.4)#469 |
| 23. | Brambleton | 1.2% | 10.0%(-8.78)#23 | 12.5%(-11.3)#484 |
| 24. | Linton Hall | 1.2% | 10.0%(-8.78)#24 | 12.5%(-11.3)#487 |
| 25. | Stafford Courthouse | 1.3% | 10.0%(-8.72)#25 | 12.5%(-11.3)#524 |
| 26. | Wyndham | 1.3% | 10.0%(-8.70)#26 | 12.5%(-11.3)#545 |
| 27. | Stewartsville | 1.4% | 10.0%(-8.62)#27 | 12.5%(-11.2)#601 |
| 28. | Tangier | 1.4% | 10.0%(-8.54)#28 | 12.5%(-11.1)#676 |
| 29. | Branchville | 1.5% | 10.0%(-8.45)#29 | 12.5%(-11.0)#738 |
| 30. | Hiltons | 1.6% | 10.0%(-8.43)#30 | 12.5%(-11.0)#753 |
| 31. | Bealeton | 1.6% | 10.0%(-8.40)#31 | 12.5%(-11.0)#775 |
| 32. | Wattsville | 1.6% | 10.0%(-8.37)#32 | 12.5%(-10.9)#798 |
| 33. | Independent Hill | 1.7% | 10.0%(-8.32)#33 | 12.5%(-10.9)#850 |
| 34. | Broadlands | 1.7% | 10.0%(-8.27)#34 | 12.5%(-10.8)#887 |
| 35. | Fort Hunt | 1.8% | 10.0%(-8.21)#35 | 12.5%(-10.8)#937 |
| 36. | Hampden Sydney | 1.8% | 10.0%(-8.15)#36 | 12.5%(-10.7)#987 |
| 37. | Lake Land Or | 1.9% | 10.0%(-8.10)#37 | 12.5%(-10.6)#1,034 |
| 38. | New Baltimore | 1.9% | 10.0%(-8.08)#38 | 12.5%(-10.6)#1,047 |
| 39. | Opal | 2.0% | 10.0%(-8.00)#39 | 12.5%(-10.6)#1,120 |
| 40. | Weyers Cave | 2.0% | 10.0%(-8.00)#40 | 12.5%(-10.5)#1,126 |
| 41. | Rose Hill Cdp Fairfax County | 2.0% | 10.0%(-7.98)#41 | 12.5%(-10.5)#1,141 |
| 42. | Captains Cove | 2.0% | 10.0%(-7.97)#42 | 12.5%(-10.5)#1,155 |
| 43. | Burke | 2.0% | 10.0%(-7.94)#43 | 12.5%(-10.5)#1,188 |
| 44. | Lake Wilderness | 2.1% | 10.0%(-7.92)#44 | 12.5%(-10.5)#1,207 |
| 45. | Franklin Farm | 2.1% | 10.0%(-7.87)#45 | 12.5%(-10.4)#1,258 |
| 46. | Fairfax Station | 2.1% | 10.0%(-7.86)#46 | 12.5%(-10.4)#1,267 |
| 47. | Dinwiddie | 2.1% | 10.0%(-7.84)#47 | 12.5%(-10.4)#1,288 |
| 48. | Abbs Valley | 2.2% | 10.0%(-7.81)#48 | 12.5%(-10.4)#1,313 |
| 49. | Floris | 2.2% | 10.0%(-7.78)#49 | 12.5%(-10.3)#1,356 |
| 50. | Pantops | 2.2% | 10.0%(-7.76)#50 | 12.5%(-10.3)#1,377 |
| 51. | Great Falls | 2.3% | 10.0%(-7.71)#51 | 12.5%(-10.3)#1,416 |
| 52. | Falls Church | 2.3% | 10.0%(-7.66)#52 | 12.5%(-10.2)#1,470 |
| 53. | Sedley | 2.3% | 10.0%(-7.66)#53 | 12.5%(-10.2)#1,472 |
| 54. | Oak Grove | 2.3% | 10.0%(-7.66)#54 | 12.5%(-10.2)#1,473 |
| 55. | Laurel Hill | 2.3% | 10.0%(-7.64)#55 | 12.5%(-10.2)#1,497 |
| 56. | Camptown | 2.4% | 10.0%(-7.59)#56 | 12.5%(-10.1)#1,549 |
| 57. | Cascades | 2.4% | 10.0%(-7.59)#57 | 12.5%(-10.1)#1,553 |
| 58. | Augusta Springs | 2.4% | 10.0%(-7.57)#58 | 12.5%(-10.1)#1,583 |
| 59. | Mclean | 2.5% | 10.0%(-7.53)#59 | 12.5%(-10.1)#1,625 |
| 60. | Lake Holiday | 2.5% | 10.0%(-7.52)#60 | 12.5%(-10.1)#1,631 |
| 61. | Countryside | 2.5% | 10.0%(-7.48)#61 | 12.5%(-10.0)#1,678 |
| 62. | Arcola | 2.5% | 10.0%(-7.44)#62 | 12.5%(-9.99)#1,723 |
| 63. | Occoquan | 2.6% | 10.0%(-7.37)#63 | 12.5%(-9.92)#1,796 |
| 64. | Newington | 2.7% | 10.0%(-7.29)#64 | 12.5%(-9.84)#1,887 |
| 65. | Chamberlayne | 2.8% | 10.0%(-7.20)#65 | 12.5%(-9.75)#1,988 |
| 66. | Cana | 2.8% | 10.0%(-7.20)#66 | 12.5%(-9.75)#1,989 |
| 67. | Brightwood | 2.8% | 10.0%(-7.17)#67 | 12.5%(-9.72)#2,027 |
| 68. | Fort Lee | 2.8% | 10.0%(-7.15)#68 | 12.5%(-9.70)#2,044 |
| 69. | Wolf Trap | 2.8% | 10.0%(-7.14)#69 | 12.5%(-9.69)#2,057 |
| 70. | Round Hill | 2.8% | 10.0%(-7.14)#70 | 12.5%(-9.69)#2,061 |
| 71. | Massanetta Springs | 2.9% | 10.0%(-7.10)#71 | 12.5%(-9.65)#2,113 |
| 72. | Union Hall | 2.9% | 10.0%(-7.09)#72 | 12.5%(-9.64)#2,126 |
| 73. | Ivy | 2.9% | 10.0%(-7.05)#73 | 12.5%(-9.60)#2,164 |
| 74. | Mantua | 2.9% | 10.0%(-7.04)#74 | 12.5%(-9.59)#2,167 |
| 75. | County Center | 3.0% | 10.0%(-7.00)#75 | 12.5%(-9.55)#2,208 |
| 76. | Belle Haven | 3.0% | 10.0%(-6.98)#76 | 12.5%(-9.53)#2,240 |
| 77. | Laurel Park | 3.1% | 10.0%(-6.93)#77 | 12.5%(-9.48)#2,291 |
| 78. | Dranesville | 3.1% | 10.0%(-6.92)#78 | 12.5%(-9.47)#2,304 |
| 79. | Woodlake | 3.1% | 10.0%(-6.88)#79 | 12.5%(-9.43)#2,352 |
| 80. | Ashburn | 3.1% | 10.0%(-6.84)#80 | 12.5%(-9.39)#2,402 |
| 81. | Crosspointe | 3.2% | 10.0%(-6.82)#81 | 12.5%(-9.37)#2,426 |
| 82. | Lunenburg | 3.2% | 10.0%(-6.80)#82 | 12.5%(-9.35)#2,444 |
| 83. | Loudoun Valley Estates | 3.3% | 10.0%(-6.71)#83 | 12.5%(-9.26)#2,567 |
| 84. | Midlothian | 3.3% | 10.0%(-6.71)#84 | 12.5%(-9.26)#2,588 |
| 85. | Union Mill | 3.3% | 10.0%(-6.66)#85 | 12.5%(-9.21)#2,647 |
| 86. | Lake Barcroft | 3.4% | 10.0%(-6.62)#86 | 12.5%(-9.17)#2,702 |
| 87. | Benns Church | 3.4% | 10.0%(-6.61)#87 | 12.5%(-9.16)#2,715 |
| 88. | Weems | 3.4% | 10.0%(-6.58)#88 | 12.5%(-9.13)#2,758 |
| 89. | Blue Ridge Shores | 3.5% | 10.0%(-6.53)#89 | 12.5%(-9.08)#2,819 |
| 90. | Gainesville | 3.5% | 10.0%(-6.49)#90 | 12.5%(-9.04)#2,877 |
| 91. | Long Branch | 3.5% | 10.0%(-6.47)#91 | 12.5%(-9.02)#2,903 |
| 92. | Pimmit Hills | 3.5% | 10.0%(-6.45)#92 | 12.5%(-9.00)#2,957 |
| 93. | Wachapreague | 3.6% | 10.0%(-6.43)#93 | 12.5%(-8.98)#2,981 |
| 94. | Montclair | 3.6% | 10.0%(-6.40)#94 | 12.5%(-8.95)#3,027 |
| 95. | Dahlgren | 3.6% | 10.0%(-6.39)#95 | 12.5%(-8.94)#3,049 |
| 96. | Belmont Estates | 3.6% | 10.0%(-6.38)#96 | 12.5%(-8.93)#3,064 |
| 97. | Newington Forest | 3.6% | 10.0%(-6.38)#97 | 12.5%(-8.93)#3,068 |
| 98. | Daleville | 3.6% | 10.0%(-6.34)#98 | 12.5%(-8.89)#3,117 |
| 99. | West Springfield | 3.7% | 10.0%(-6.31)#99 | 12.5%(-8.86)#3,160 |
| 100. | Piney Mountain | 3.8% | 10.0%(-6.19)#100 | 12.5%(-8.74)#3,300 |
Common Questions
What are the Top 10 Cities with the Lowest Poverty Level in Virginia?
Top 10 Cities with the Lowest Poverty Level in Virginia are:
#1
0.30%
#2
0.32%
#3
0.45%
#4
0.47%
#5
0.52%
#6
0.61%
#7
0.64%
#8
0.66%
#9
0.84%
#10
0.84%
What city has the Lowest Poverty Level in Virginia?
Hamilton has the Lowest Poverty Level in Virginia with 0.30%.
What is the Poverty Level in the State of Virginia?
Poverty Level in Virginia is 10.0%.
What is the Poverty Level in the United States?
Poverty Level in the United States is 12.5%.