Cities with the Lowest Poverty Level in Illinois
RELATED REPORTS & OPTIONS
Lowest Poverty
Illinois
Compare Cities
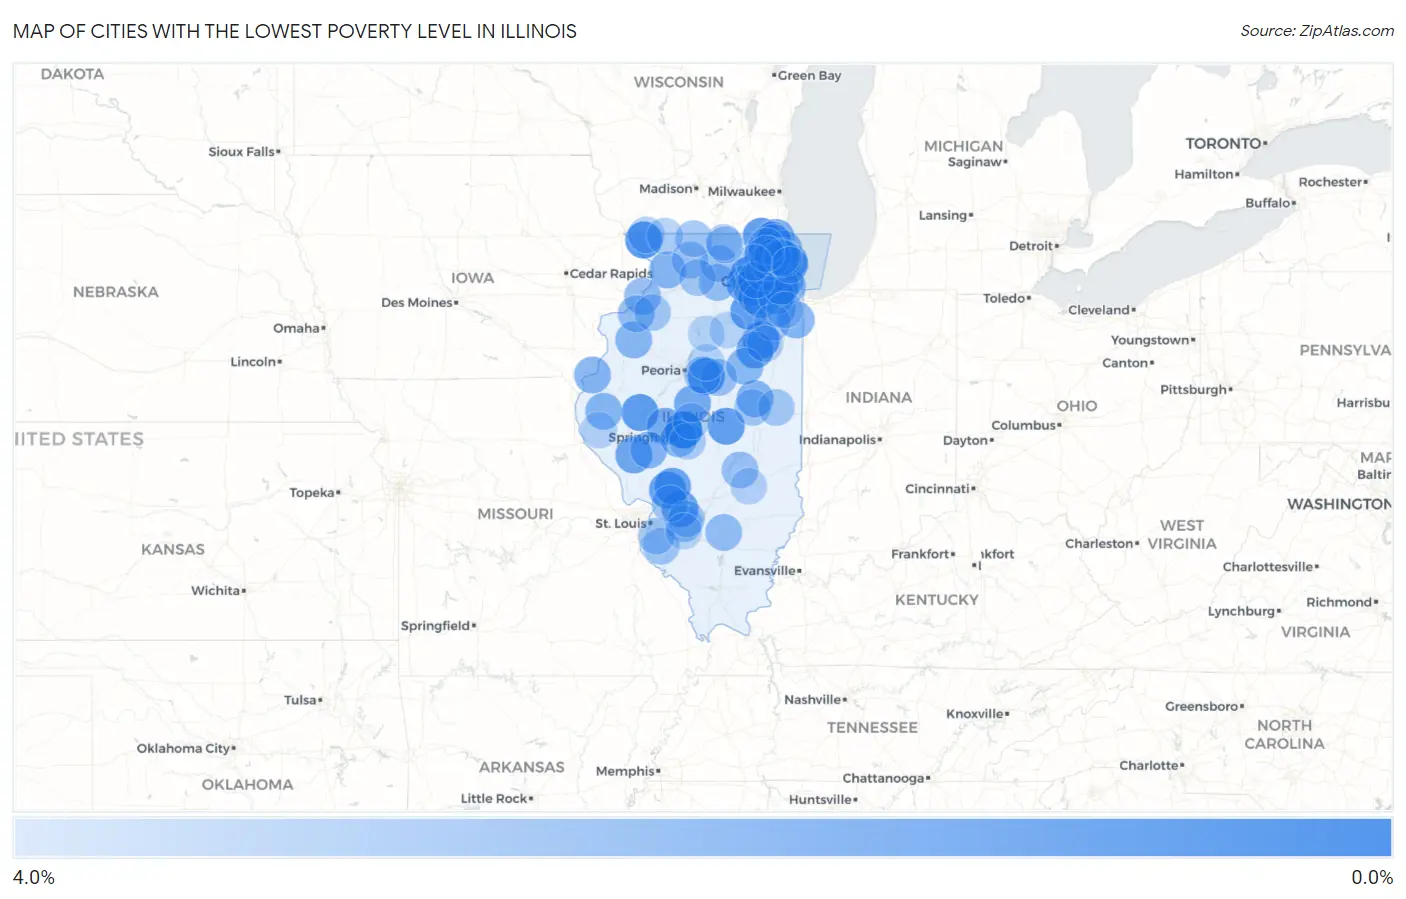
Map of Cities with the Lowest Poverty Level in Illinois
4.0%
0.0%
Cities with the Lowest Poverty Level in Illinois
| City | Poverty | vs State | vs National | |
| 1. | Sherman | 0.22% | 11.8%(-11.5)#1 | 12.5%(-12.3)#28 |
| 2. | Lily Lake | 0.72% | 11.8%(-11.0)#2 | 12.5%(-11.8)#218 |
| 3. | Congerville | 0.78% | 11.8%(-11.0)#3 | 12.5%(-11.8)#246 |
| 4. | The Galena Territory | 0.93% | 11.8%(-10.8)#4 | 12.5%(-11.6)#324 |
| 5. | Wayne | 0.95% | 11.8%(-10.8)#5 | 12.5%(-11.6)#332 |
| 6. | Reddick | 1.0% | 11.8%(-10.8)#6 | 12.5%(-11.5)#361 |
| 7. | Browning | 1.1% | 11.8%(-10.7)#7 | 12.5%(-11.4)#407 |
| 8. | Lisbon | 1.1% | 11.8%(-10.7)#8 | 12.5%(-11.4)#413 |
| 9. | Spring Grove | 1.1% | 11.8%(-10.6)#9 | 12.5%(-11.4)#448 |
| 10. | Oreana | 1.2% | 11.8%(-10.6)#10 | 12.5%(-11.4)#461 |
| 11. | Dorchester | 1.2% | 11.8%(-10.6)#11 | 12.5%(-11.3)#493 |
| 12. | Kaneville | 1.2% | 11.8%(-10.5)#12 | 12.5%(-11.3)#501 |
| 13. | River Forest | 1.2% | 11.8%(-10.5)#13 | 12.5%(-11.3)#507 |
| 14. | Emington | 1.3% | 11.8%(-10.5)#14 | 12.5%(-11.3)#519 |
| 15. | Grantfork | 1.3% | 11.8%(-10.5)#15 | 12.5%(-11.3)#547 |
| 16. | Hawthorn Woods | 1.3% | 11.8%(-10.5)#16 | 12.5%(-11.2)#562 |
| 17. | Westlake | 1.3% | 11.8%(-10.4)#17 | 12.5%(-11.2)#566 |
| 18. | South Barrington | 1.4% | 11.8%(-10.4)#18 | 12.5%(-11.2)#597 |
| 19. | East Gillespie | 1.4% | 11.8%(-10.4)#19 | 12.5%(-11.2)#616 |
| 20. | Long Grove | 1.4% | 11.8%(-10.4)#20 | 12.5%(-11.1)#617 |
| 21. | Hinsdale | 1.4% | 11.8%(-10.3)#21 | 12.5%(-11.1)#647 |
| 22. | Glasgow | 1.4% | 11.8%(-10.3)#22 | 12.5%(-11.1)#668 |
| 23. | Winfield | 1.5% | 11.8%(-10.3)#23 | 12.5%(-11.1)#678 |
| 24. | Deer Park | 1.5% | 11.8%(-10.3)#24 | 12.5%(-11.0)#695 |
| 25. | Port Barrington | 1.5% | 11.8%(-10.3)#25 | 12.5%(-11.0)#712 |
| 26. | Hartsburg | 1.6% | 11.8%(-10.2)#26 | 12.5%(-10.9)#793 |
| 27. | Old Mill Creek | 1.6% | 11.8%(-10.1)#27 | 12.5%(-10.9)#825 |
| 28. | Tallula | 1.7% | 11.8%(-10.1)#28 | 12.5%(-10.9)#851 |
| 29. | Plum Valley | 1.7% | 11.8%(-10.0)#29 | 12.5%(-10.8)#898 |
| 30. | Prestbury | 1.8% | 11.8%(-10.0)#30 | 12.5%(-10.8)#930 |
| 31. | Fisher | 1.9% | 11.8%(-9.90)#31 | 12.5%(-10.7)#1,007 |
| 32. | Glencoe | 1.9% | 11.8%(-9.90)#32 | 12.5%(-10.7)#1,008 |
| 33. | Venetian Village | 1.9% | 11.8%(-9.89)#33 | 12.5%(-10.7)#1,021 |
| 34. | Winnetka | 1.9% | 11.8%(-9.88)#34 | 12.5%(-10.7)#1,027 |
| 35. | Woodson | 1.9% | 11.8%(-9.84)#35 | 12.5%(-10.6)#1,059 |
| 36. | Pontoosuc | 1.9% | 11.8%(-9.84)#36 | 12.5%(-10.6)#1,064 |
| 37. | La Prairie | 2.0% | 11.8%(-9.80)#37 | 12.5%(-10.6)#1,101 |
| 38. | Lake Bluff | 2.0% | 11.8%(-9.80)#38 | 12.5%(-10.6)#1,105 |
| 39. | Beecher | 2.0% | 11.8%(-9.78)#39 | 12.5%(-10.6)#1,119 |
| 40. | Chadwick | 2.0% | 11.8%(-9.77)#40 | 12.5%(-10.5)#1,130 |
| 41. | North Henderson | 2.0% | 11.8%(-9.75)#41 | 12.5%(-10.5)#1,147 |
| 42. | New Lenox | 2.0% | 11.8%(-9.73)#42 | 12.5%(-10.5)#1,173 |
| 43. | Oswego | 2.0% | 11.8%(-9.73)#43 | 12.5%(-10.5)#1,174 |
| 44. | Fairbury | 2.1% | 11.8%(-9.69)#44 | 12.5%(-10.5)#1,220 |
| 45. | Forest View | 2.1% | 11.8%(-9.63)#45 | 12.5%(-10.4)#1,280 |
| 46. | Cordova | 2.2% | 11.8%(-9.59)#46 | 12.5%(-10.4)#1,307 |
| 47. | Leland Grove | 2.2% | 11.8%(-9.59)#47 | 12.5%(-10.4)#1,318 |
| 48. | Baileyville | 2.2% | 11.8%(-9.57)#48 | 12.5%(-10.3)#1,339 |
| 49. | Fox River Grove | 2.2% | 11.8%(-9.55)#49 | 12.5%(-10.3)#1,367 |
| 50. | Coal Valley | 2.2% | 11.8%(-9.52)#50 | 12.5%(-10.3)#1,396 |
| 51. | Bannockburn | 2.3% | 11.8%(-9.51)#51 | 12.5%(-10.3)#1,399 |
| 52. | Plainfield | 2.3% | 11.8%(-9.50)#52 | 12.5%(-10.3)#1,401 |
| 53. | Kell | 2.3% | 11.8%(-9.48)#53 | 12.5%(-10.2)#1,429 |
| 54. | Steward | 2.3% | 11.8%(-9.47)#54 | 12.5%(-10.2)#1,435 |
| 55. | Third Lake | 2.3% | 11.8%(-9.46)#55 | 12.5%(-10.2)#1,450 |
| 56. | Forest Lake | 2.4% | 11.8%(-9.38)#56 | 12.5%(-10.2)#1,533 |
| 57. | Hudson | 2.4% | 11.8%(-9.38)#57 | 12.5%(-10.2)#1,540 |
| 58. | Monroe Center | 2.4% | 11.8%(-9.37)#58 | 12.5%(-10.1)#1,548 |
| 59. | Adeline | 2.4% | 11.8%(-9.35)#59 | 12.5%(-10.1)#1,568 |
| 60. | Bartlett | 2.4% | 11.8%(-9.35)#60 | 12.5%(-10.1)#1,573 |
| 61. | Goodfield | 2.4% | 11.8%(-9.33)#61 | 12.5%(-10.1)#1,593 |
| 62. | Strasburg | 2.4% | 11.8%(-9.33)#62 | 12.5%(-10.1)#1,597 |
| 63. | Aviston | 2.4% | 11.8%(-9.33)#63 | 12.5%(-10.1)#1,605 |
| 64. | Itasca | 2.5% | 11.8%(-9.30)#64 | 12.5%(-10.1)#1,633 |
| 65. | Lemont | 2.5% | 11.8%(-9.28)#65 | 12.5%(-10.0)#1,660 |
| 66. | Davis | 2.5% | 11.8%(-9.27)#66 | 12.5%(-10.0)#1,663 |
| 67. | Inverness | 2.5% | 11.8%(-9.26)#67 | 12.5%(-10.0)#1,682 |
| 68. | Hecker | 2.5% | 11.8%(-9.26)#68 | 12.5%(-10.0)#1,684 |
| 69. | Timberlane | 2.5% | 11.8%(-9.23)#69 | 12.5%(-10.00)#1,717 |
| 70. | Western Springs | 2.6% | 11.8%(-9.20)#70 | 12.5%(-9.97)#1,745 |
| 71. | Geneva | 2.6% | 11.8%(-9.20)#71 | 12.5%(-9.97)#1,756 |
| 72. | Kildeer | 2.6% | 11.8%(-9.20)#72 | 12.5%(-9.97)#1,758 |
| 73. | Millstadt | 2.6% | 11.8%(-9.16)#73 | 12.5%(-9.93)#1,789 |
| 74. | Lost Nation | 2.6% | 11.8%(-9.15)#74 | 12.5%(-9.92)#1,795 |
| 75. | Mahomet | 2.6% | 11.8%(-9.12)#75 | 12.5%(-9.89)#1,829 |
| 76. | St Rose | 2.6% | 11.8%(-9.12)#76 | 12.5%(-9.89)#1,833 |
| 77. | Geneseo | 2.7% | 11.8%(-9.11)#77 | 12.5%(-9.88)#1,836 |
| 78. | Royal | 2.7% | 11.8%(-9.11)#78 | 12.5%(-9.88)#1,838 |
| 79. | Deerfield | 2.7% | 11.8%(-9.11)#79 | 12.5%(-9.88)#1,848 |
| 80. | Volo | 2.7% | 11.8%(-9.05)#80 | 12.5%(-9.82)#1,913 |
| 81. | Symerton | 2.7% | 11.8%(-9.02)#81 | 12.5%(-9.79)#1,942 |
| 82. | Hamel | 2.7% | 11.8%(-9.01)#82 | 12.5%(-9.79)#1,951 |
| 83. | Scales Mound | 2.8% | 11.8%(-8.99)#83 | 12.5%(-9.76)#1,980 |
| 84. | Riverwoods | 2.8% | 11.8%(-8.93)#84 | 12.5%(-9.70)#2,048 |
| 85. | Nora | 2.8% | 11.8%(-8.92)#85 | 12.5%(-9.69)#2,053 |
| 86. | Rochester | 2.8% | 11.8%(-8.92)#86 | 12.5%(-9.69)#2,058 |
| 87. | Elkhart | 2.9% | 11.8%(-8.89)#87 | 12.5%(-9.67)#2,093 |
| 88. | Tower Lakes | 2.9% | 11.8%(-8.86)#88 | 12.5%(-9.64)#2,131 |
| 89. | Caledonia | 2.9% | 11.8%(-8.86)#89 | 12.5%(-9.63)#2,137 |
| 90. | Wilmette | 2.9% | 11.8%(-8.86)#90 | 12.5%(-9.63)#2,138 |
| 91. | Arbury Hills | 2.9% | 11.8%(-8.84)#91 | 12.5%(-9.61)#2,161 |
| 92. | Buckingham | 3.0% | 11.8%(-8.78)#92 | 12.5%(-9.56)#2,205 |
| 93. | Teutopolis | 3.0% | 11.8%(-8.77)#93 | 12.5%(-9.54)#2,225 |
| 94. | Liberty | 3.0% | 11.8%(-8.77)#94 | 12.5%(-9.54)#2,226 |
| 95. | Gilberts | 3.0% | 11.8%(-8.76)#95 | 12.5%(-9.53)#2,245 |
| 96. | Roanoke | 3.0% | 11.8%(-8.75)#96 | 12.5%(-9.52)#2,248 |
| 97. | Frankfort | 3.0% | 11.8%(-8.74)#97 | 12.5%(-9.52)#2,255 |
| 98. | Mcnabb | 3.0% | 11.8%(-8.73)#98 | 12.5%(-9.50)#2,266 |
| 99. | Grand Ridge | 3.0% | 11.8%(-8.73)#99 | 12.5%(-9.50)#2,270 |
| 100. | Damiansville | 3.1% | 11.8%(-8.69)#100 | 12.5%(-9.46)#2,312 |
Common Questions
What are the Top 10 Cities with the Lowest Poverty Level in Illinois?
Top 10 Cities with the Lowest Poverty Level in Illinois are:
#1
0.22%
#2
0.72%
#3
0.78%
#4
0.93%
#5
0.95%
#6
1.0%
#7
1.1%
#8
1.1%
#9
1.1%
#10
1.2%
What city has the Lowest Poverty Level in Illinois?
Sherman has the Lowest Poverty Level in Illinois with 0.22%.
What is the Poverty Level in the State of Illinois?
Poverty Level in Illinois is 11.8%.
What is the Poverty Level in the United States?
Poverty Level in the United States is 12.5%.