Cities with the Most Immigrants from Ukraine in Massachusetts
RELATED REPORTS & OPTIONS
Ukraine
Massachusetts
Compare Cities
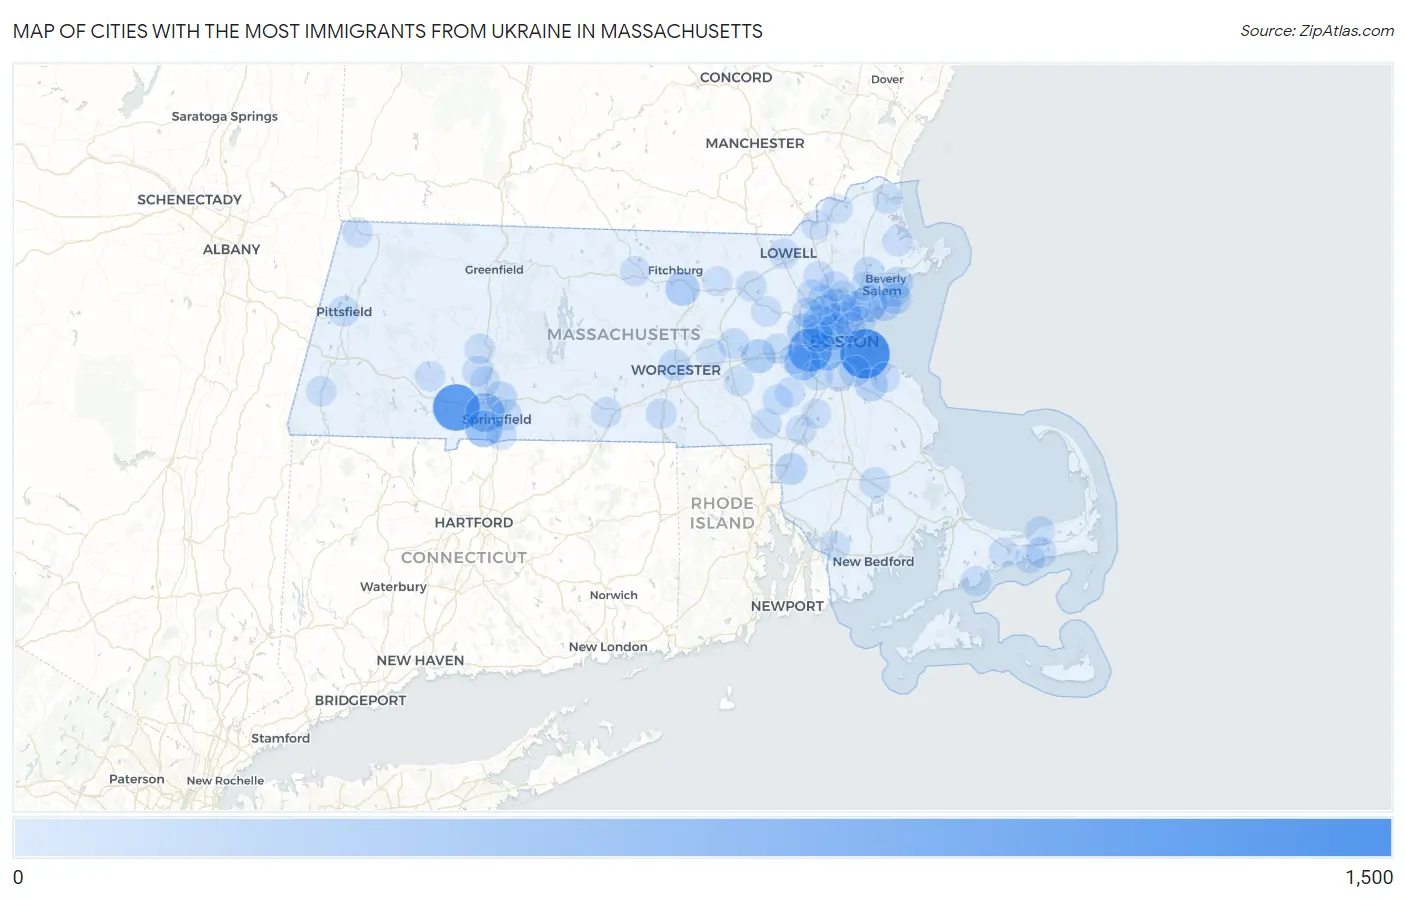
Map of Cities with the Most Immigrants from Ukraine in Massachusetts
0
1,500
Cities with the Most Immigrants from Ukraine in Massachusetts
| City | Ukraine | vs State | vs National | |
| 1. | Boston | 1,076 | 10,808(9.96%)#1 | 383,359(0.28%)#30 |
| 2. | Westfield | 912 | 10,808(8.44%)#2 | 383,359(0.24%)#36 |
| 3. | Newton | 713 | 10,808(6.60%)#3 | 383,359(0.19%)#51 |
| 4. | West Springfield Town | 474 | 10,808(4.39%)#4 | 383,359(0.12%)#92 |
| 5. | Brookline | 448 | 10,808(4.15%)#5 | 383,359(0.12%)#98 |
| 6. | Agawam Town | 366 | 10,808(3.39%)#6 | 383,359(0.10%)#130 |
| 7. | Lynn | 360 | 10,808(3.33%)#7 | 383,359(0.09%)#133 |
| 8. | Needham | 304 | 10,808(2.81%)#8 | 383,359(0.08%)#161 |
| 9. | Arlington | 241 | 10,808(2.23%)#9 | 383,359(0.06%)#216 |
| 10. | Leominster | 221 | 10,808(2.04%)#10 | 383,359(0.06%)#233 |
| 11. | Cambridge | 214 | 10,808(1.98%)#11 | 383,359(0.06%)#241 |
| 12. | Framingham | 204 | 10,808(1.89%)#12 | 383,359(0.05%)#252 |
| 13. | Waltham | 178 | 10,808(1.65%)#13 | 383,359(0.05%)#297 |
| 14. | Weymouth Town | 147 | 10,808(1.36%)#14 | 383,359(0.04%)#357 |
| 15. | Malden | 145 | 10,808(1.34%)#15 | 383,359(0.04%)#361 |
| 16. | Stoneham | 136 | 10,808(1.26%)#16 | 383,359(0.04%)#385 |
| 17. | Swampscott | 112 | 10,808(1.04%)#17 | 383,359(0.03%)#461 |
| 18. | Attleboro | 100 | 10,808(0.93%)#18 | 383,359(0.03%)#513 |
| 19. | Worcester | 88 | 10,808(0.81%)#19 | 383,359(0.02%)#585 |
| 20. | Chicopee | 87 | 10,808(0.80%)#20 | 383,359(0.02%)#593 |
| 21. | Salem | 84 | 10,808(0.78%)#21 | 383,359(0.02%)#611 |
| 22. | Belmont | 84 | 10,808(0.78%)#22 | 383,359(0.02%)#615 |
| 23. | Beverly | 80 | 10,808(0.74%)#23 | 383,359(0.02%)#642 |
| 24. | Danvers | 78 | 10,808(0.72%)#24 | 383,359(0.02%)#656 |
| 25. | Amherst | 73 | 10,808(0.68%)#25 | 383,359(0.02%)#694 |
| 26. | Marblehead | 73 | 10,808(0.68%)#26 | 383,359(0.02%)#697 |
| 27. | Quincy | 63 | 10,808(0.58%)#27 | 383,359(0.02%)#790 |
| 28. | Somerville | 62 | 10,808(0.57%)#28 | 383,359(0.02%)#804 |
| 29. | Watertown Town | 60 | 10,808(0.56%)#29 | 383,359(0.02%)#823 |
| 30. | Springfield | 58 | 10,808(0.54%)#30 | 383,359(0.02%)#844 |
| 31. | Marlborough | 55 | 10,808(0.51%)#31 | 383,359(0.01%)#884 |
| 32. | Burlington | 55 | 10,808(0.51%)#32 | 383,359(0.01%)#886 |
| 33. | Dedham | 54 | 10,808(0.50%)#33 | 383,359(0.01%)#897 |
| 34. | Medford | 53 | 10,808(0.49%)#34 | 383,359(0.01%)#904 |
| 35. | Winchester | 52 | 10,808(0.48%)#35 | 383,359(0.01%)#920 |
| 36. | South Yarmouth | 44 | 10,808(0.41%)#36 | 383,359(0.01%)#1,038 |
| 37. | Pittsfield | 43 | 10,808(0.40%)#37 | 383,359(0.01%)#1,053 |
| 38. | Melrose | 42 | 10,808(0.39%)#38 | 383,359(0.01%)#1,070 |
| 39. | Middleborough Center | 42 | 10,808(0.39%)#39 | 383,359(0.01%)#1,080 |
| 40. | Wakefield | 40 | 10,808(0.37%)#40 | 383,359(0.01%)#1,101 |
| 41. | Woburn | 36 | 10,808(0.33%)#41 | 383,359(0.01%)#1,178 |
| 42. | Foxborough | 34 | 10,808(0.31%)#42 | 383,359(0.01%)#1,230 |
| 43. | Lexington | 33 | 10,808(0.31%)#43 | 383,359(0.01%)#1,239 |
| 44. | Reading | 33 | 10,808(0.31%)#44 | 383,359(0.01%)#1,243 |
| 45. | Oxford | 32 | 10,808(0.30%)#45 | 383,359(0.01%)#1,281 |
| 46. | Easthampton Town | 31 | 10,808(0.29%)#46 | 383,359(0.01%)#1,295 |
| 47. | Revere | 30 | 10,808(0.28%)#47 | 383,359(0.01%)#1,314 |
| 48. | Franklin Town | 30 | 10,808(0.28%)#48 | 383,359(0.01%)#1,320 |
| 49. | Millis Clicquot | 29 | 10,808(0.27%)#49 | 383,359(0.01%)#1,357 |
| 50. | Littleton Common | 27 | 10,808(0.25%)#50 | 383,359(0.01%)#1,402 |
| 51. | Northampton | 26 | 10,808(0.24%)#51 | 383,359(0.01%)#1,420 |
| 52. | Wilmington | 26 | 10,808(0.24%)#52 | 383,359(0.01%)#1,423 |
| 53. | Lowell | 24 | 10,808(0.22%)#53 | 383,359(0.01%)#1,464 |
| 54. | Chelsea | 24 | 10,808(0.22%)#54 | 383,359(0.01%)#1,473 |
| 55. | West Concord | 24 | 10,808(0.22%)#55 | 383,359(0.01%)#1,488 |
| 56. | Fiskdale | 24 | 10,808(0.22%)#56 | 383,359(0.01%)#1,493 |
| 57. | Wellesley | 21 | 10,808(0.19%)#57 | 383,359(0.01%)#1,583 |
| 58. | Great Barrington | 21 | 10,808(0.19%)#58 | 383,359(0.01%)#1,621 |
| 59. | New Seabury | 21 | 10,808(0.19%)#59 | 383,359(0.01%)#1,625 |
| 60. | Ipswich | 20 | 10,808(0.19%)#60 | 383,359(0.01%)#1,661 |
| 61. | Barnstable Town | 18 | 10,808(0.17%)#61 | 383,359(0.00%)#1,722 |
| 62. | Longmeadow | 17 | 10,808(0.16%)#62 | 383,359(0.00%)#1,781 |
| 63. | Huntington | 16 | 10,808(0.15%)#63 | 383,359(0.00%)#1,865 |
| 64. | Methuen Town | 15 | 10,808(0.14%)#64 | 383,359(0.00%)#1,870 |
| 65. | Gardner | 14 | 10,808(0.13%)#65 | 383,359(0.00%)#1,936 |
| 66. | West Yarmouth | 14 | 10,808(0.13%)#66 | 383,359(0.00%)#1,963 |
| 67. | Dennis | 13 | 10,808(0.12%)#67 | 383,359(0.00%)#2,022 |
| 68. | Cochituate | 12 | 10,808(0.11%)#68 | 383,359(0.00%)#2,070 |
| 69. | Hingham | 11 | 10,808(0.10%)#69 | 383,359(0.00%)#2,148 |
| 70. | Newburyport | 10 | 10,808(0.09%)#70 | 383,359(0.00%)#2,192 |
| 71. | Medfield | 10 | 10,808(0.09%)#71 | 383,359(0.00%)#2,218 |
| 72. | Williamstown | 10 | 10,808(0.09%)#72 | 383,359(0.00%)#2,224 |
| 73. | Hopkinton | 10 | 10,808(0.09%)#73 | 383,359(0.00%)#2,231 |
| 74. | Holyoke | 9 | 10,808(0.08%)#74 | 383,359(0.00%)#2,259 |
| 75. | North Attleborough | 9 | 10,808(0.08%)#75 | 383,359(0.00%)#2,263 |
| 76. | Fall River | 8 | 10,808(0.07%)#76 | 383,359(0.00%)#2,328 |
| 77. | Saugus | 8 | 10,808(0.07%)#77 | 383,359(0.00%)#2,342 |
| 78. | Haverhill | 7 | 10,808(0.06%)#78 | 383,359(0.00%)#2,417 |
| 79. | Devens | 7 | 10,808(0.06%)#79 | 383,359(0.00%)#2,472 |
| 80. | Milton | 5 | 10,808(0.05%)#80 | 383,359(0.00%)#2,574 |
| 81. | Northborough | 5 | 10,808(0.05%)#81 | 383,359(0.00%)#2,596 |
| 82. | Sharon | 5 | 10,808(0.05%)#82 | 383,359(0.00%)#2,598 |
| 83. | Peabody | 3 | 10,808(0.03%)#83 | 383,359(0.00%)#2,717 |
Common Questions
What are the Top 10 Cities with the Most Immigrants from Ukraine in Massachusetts?
Top 10 Cities with the Most Immigrants from Ukraine in Massachusetts are:
#1
1,076
#2
912
#3
713
#4
474
#5
448
#6
366
#7
360
#8
304
#9
241
#10
221
What city has the Most Immigrants from Ukraine in Massachusetts?
Boston has the Most Immigrants from Ukraine in Massachusetts with 1,076.
What is the Total Immigrants from Ukraine in the State of Massachusetts?
Total Immigrants from Ukraine in Massachusetts is 10,808.
What is the Total Immigrants from Ukraine in the United States?
Total Immigrants from Ukraine in the United States is 383,359.