Cities with the Most Immigrants from Ukraine in Ohio
RELATED REPORTS & OPTIONS
Ukraine
Ohio
Compare Cities
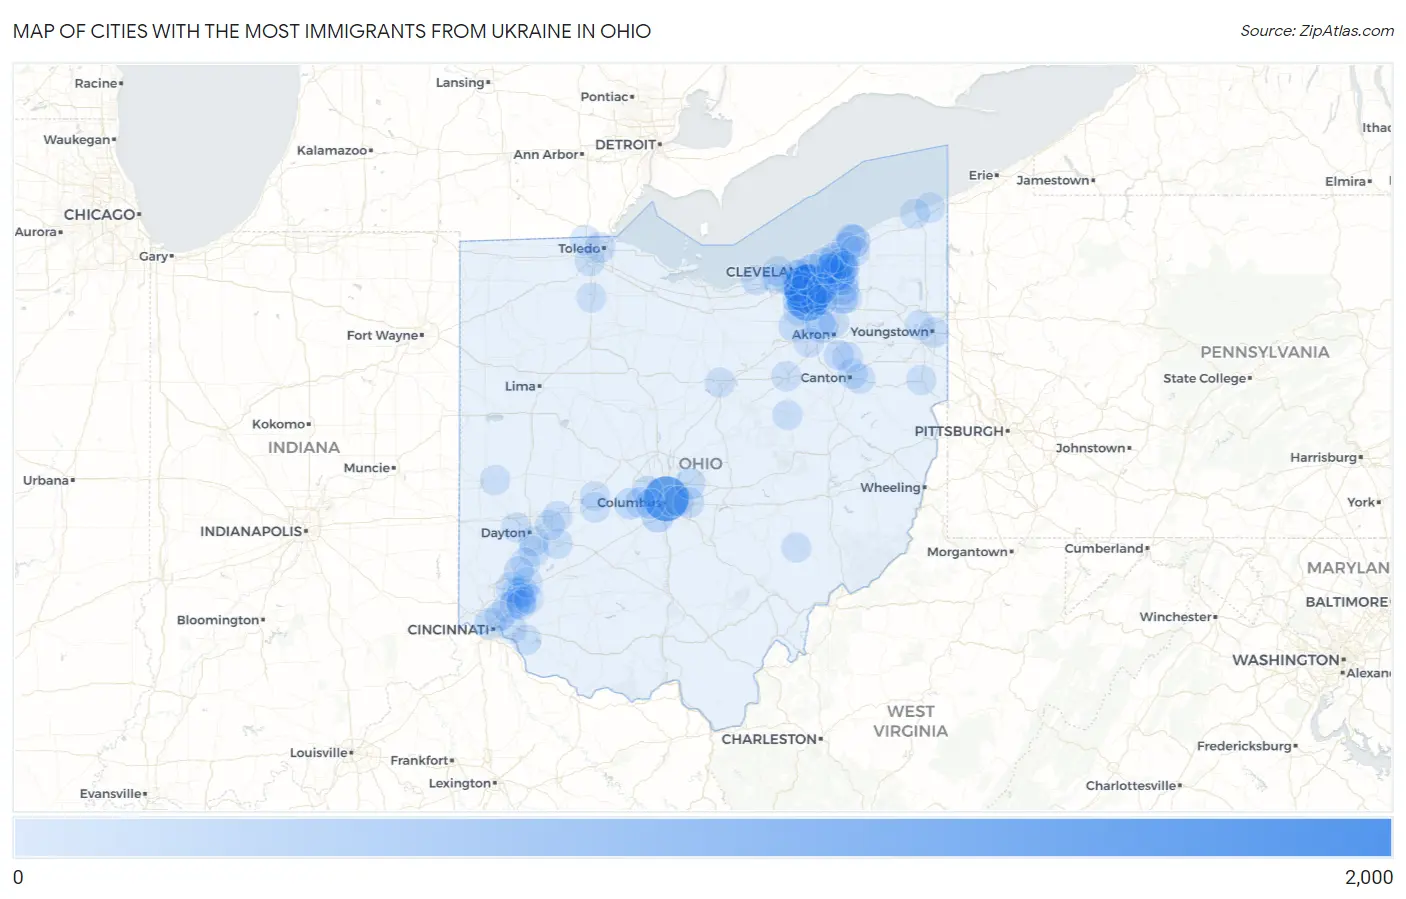
Map of Cities with the Most Immigrants from Ukraine in Ohio
0
2,000
Cities with the Most Immigrants from Ukraine in Ohio
| City | Ukraine | vs State | vs National | |
| 1. | Parma | 1,506 | 9,564(15.75%)#1 | 383,359(0.39%)#20 |
| 2. | Columbus | 1,147 | 9,564(11.99%)#2 | 383,359(0.30%)#27 |
| 3. | North Royalton | 871 | 9,564(9.11%)#3 | 383,359(0.23%)#39 |
| 4. | Mayfield Heights | 326 | 9,564(3.41%)#4 | 383,359(0.09%)#144 |
| 5. | Cleveland | 312 | 9,564(3.26%)#5 | 383,359(0.08%)#156 |
| 6. | Mentor | 229 | 9,564(2.39%)#6 | 383,359(0.06%)#223 |
| 7. | Parma Heights | 225 | 9,564(2.35%)#7 | 383,359(0.06%)#229 |
| 8. | Solon | 191 | 9,564(2.00%)#8 | 383,359(0.05%)#267 |
| 9. | Grove City | 178 | 9,564(1.86%)#9 | 383,359(0.05%)#298 |
| 10. | Beachwood | 164 | 9,564(1.71%)#10 | 383,359(0.04%)#322 |
| 11. | Strongsville | 161 | 9,564(1.68%)#11 | 383,359(0.04%)#328 |
| 12. | Richmond Heights | 152 | 9,564(1.59%)#12 | 383,359(0.04%)#348 |
| 13. | Seven Hills | 149 | 9,564(1.56%)#13 | 383,359(0.04%)#355 |
| 14. | Lyndhurst | 134 | 9,564(1.40%)#14 | 383,359(0.03%)#391 |
| 15. | South Euclid | 127 | 9,564(1.33%)#15 | 383,359(0.03%)#410 |
| 16. | Cincinnati | 112 | 9,564(1.17%)#16 | 383,359(0.03%)#459 |
| 17. | Fairlawn | 101 | 9,564(1.06%)#17 | 383,359(0.03%)#511 |
| 18. | Reminderville | 97 | 9,564(1.01%)#18 | 383,359(0.03%)#537 |
| 19. | Broadview Heights | 93 | 9,564(0.97%)#19 | 383,359(0.02%)#561 |
| 20. | Mason | 90 | 9,564(0.94%)#20 | 383,359(0.02%)#578 |
| 21. | West Jefferson | 90 | 9,564(0.94%)#21 | 383,359(0.02%)#580 |
| 22. | Kings Mills | 71 | 9,564(0.74%)#22 | 383,359(0.02%)#722 |
| 23. | Bexley | 68 | 9,564(0.71%)#23 | 383,359(0.02%)#750 |
| 24. | Hilliard | 67 | 9,564(0.70%)#24 | 383,359(0.02%)#755 |
| 25. | Orange | 67 | 9,564(0.70%)#25 | 383,359(0.02%)#759 |
| 26. | Brook Park | 66 | 9,564(0.69%)#26 | 383,359(0.02%)#768 |
| 27. | New Albany | 64 | 9,564(0.67%)#27 | 383,359(0.02%)#788 |
| 28. | Moreland Hills | 62 | 9,564(0.65%)#28 | 383,359(0.02%)#808 |
| 29. | Four Bridges | 61 | 9,564(0.64%)#29 | 383,359(0.02%)#817 |
| 30. | Reynoldsburg | 60 | 9,564(0.63%)#30 | 383,359(0.02%)#822 |
| 31. | Willoughby | 52 | 9,564(0.54%)#31 | 383,359(0.01%)#919 |
| 32. | Pepper Pike | 50 | 9,564(0.52%)#32 | 383,359(0.01%)#952 |
| 33. | Brunswick | 49 | 9,564(0.51%)#33 | 383,359(0.01%)#963 |
| 34. | Mayfield | 49 | 9,564(0.51%)#34 | 383,359(0.01%)#970 |
| 35. | Medina | 48 | 9,564(0.50%)#35 | 383,359(0.01%)#975 |
| 36. | Brooklyn | 45 | 9,564(0.47%)#36 | 383,359(0.01%)#1,013 |
| 37. | Centerville | 41 | 9,564(0.43%)#37 | 383,359(0.01%)#1,092 |
| 38. | University Heights | 39 | 9,564(0.41%)#38 | 383,359(0.01%)#1,125 |
| 39. | Highland Heights | 39 | 9,564(0.41%)#39 | 383,359(0.01%)#1,128 |
| 40. | Lorain | 37 | 9,564(0.39%)#40 | 383,359(0.01%)#1,156 |
| 41. | Lake Darby | 36 | 9,564(0.38%)#41 | 383,359(0.01%)#1,186 |
| 42. | Toledo | 35 | 9,564(0.37%)#42 | 383,359(0.01%)#1,188 |
| 43. | Green Meadows | 35 | 9,564(0.37%)#43 | 383,359(0.01%)#1,211 |
| 44. | Cuyahoga Falls | 34 | 9,564(0.36%)#44 | 383,359(0.01%)#1,215 |
| 45. | Westlake | 33 | 9,564(0.35%)#45 | 383,359(0.01%)#1,240 |
| 46. | Twinsburg | 33 | 9,564(0.35%)#46 | 383,359(0.01%)#1,244 |
| 47. | Euclid | 32 | 9,564(0.33%)#47 | 383,359(0.01%)#1,261 |
| 48. | Landen | 32 | 9,564(0.33%)#48 | 383,359(0.01%)#1,278 |
| 49. | Rocky River | 29 | 9,564(0.30%)#49 | 383,359(0.01%)#1,345 |
| 50. | Middleburg Heights | 29 | 9,564(0.30%)#50 | 383,359(0.01%)#1,348 |
| 51. | Cleveland Heights | 28 | 9,564(0.29%)#51 | 383,359(0.01%)#1,363 |
| 52. | Canton | 24 | 9,564(0.25%)#52 | 383,359(0.01%)#1,466 |
| 53. | Kettering | 24 | 9,564(0.25%)#53 | 383,359(0.01%)#1,469 |
| 54. | Blue Ash | 23 | 9,564(0.24%)#54 | 383,359(0.01%)#1,514 |
| 55. | Sixteen Mile Stand | 22 | 9,564(0.23%)#55 | 383,359(0.01%)#1,566 |
| 56. | Mentor On The Lake | 21 | 9,564(0.22%)#56 | 383,359(0.01%)#1,608 |
| 57. | Brecksville | 20 | 9,564(0.21%)#57 | 383,359(0.01%)#1,647 |
| 58. | Xenia | 19 | 9,564(0.20%)#58 | 383,359(0.00%)#1,679 |
| 59. | Avon Lake | 19 | 9,564(0.20%)#59 | 383,359(0.00%)#1,680 |
| 60. | Whitehall | 19 | 9,564(0.20%)#60 | 383,359(0.00%)#1,684 |
| 61. | Amelia | 18 | 9,564(0.19%)#61 | 383,359(0.00%)#1,734 |
| 62. | Montrose Ghent | 18 | 9,564(0.19%)#62 | 383,359(0.00%)#1,743 |
| 63. | Youngstown | 17 | 9,564(0.18%)#63 | 383,359(0.00%)#1,769 |
| 64. | Wadsworth | 17 | 9,564(0.18%)#64 | 383,359(0.00%)#1,775 |
| 65. | Greentown | 17 | 9,564(0.18%)#65 | 383,359(0.00%)#1,797 |
| 66. | Loveland Park | 17 | 9,564(0.18%)#66 | 383,359(0.00%)#1,803 |
| 67. | Green | 14 | 9,564(0.15%)#67 | 383,359(0.00%)#1,929 |
| 68. | North Kingsville | 12 | 9,564(0.13%)#68 | 383,359(0.00%)#2,089 |
| 69. | Lakewood | 11 | 9,564(0.12%)#69 | 383,359(0.00%)#2,106 |
| 70. | Fairborn | 10 | 9,564(0.10%)#70 | 383,359(0.00%)#2,179 |
| 71. | Lebanon | 10 | 9,564(0.10%)#71 | 383,359(0.00%)#2,185 |
| 72. | Springboro | 10 | 9,564(0.10%)#72 | 383,359(0.00%)#2,189 |
| 73. | Sylvania | 10 | 9,564(0.10%)#73 | 383,359(0.00%)#2,190 |
| 74. | Ashtabula | 10 | 9,564(0.10%)#74 | 383,359(0.00%)#2,194 |
| 75. | Lincoln Village | 10 | 9,564(0.10%)#75 | 383,359(0.00%)#2,206 |
| 76. | Dry Run | 10 | 9,564(0.10%)#76 | 383,359(0.00%)#2,214 |
| 77. | Hunter | 10 | 9,564(0.10%)#77 | 383,359(0.00%)#2,227 |
| 78. | Avon | 9 | 9,564(0.09%)#78 | 383,359(0.00%)#2,267 |
| 79. | Golf Manor | 9 | 9,564(0.09%)#79 | 383,359(0.00%)#2,305 |
| 80. | Millersburg | 9 | 9,564(0.09%)#80 | 383,359(0.00%)#2,310 |
| 81. | Trotwood | 8 | 9,564(0.08%)#81 | 383,359(0.00%)#2,348 |
| 82. | Mineral Ridge | 8 | 9,564(0.08%)#82 | 383,359(0.00%)#2,383 |
| 83. | East Canton | 8 | 9,564(0.08%)#83 | 383,359(0.00%)#2,402 |
| 84. | Mansfield | 7 | 9,564(0.07%)#84 | 383,359(0.00%)#2,421 |
| 85. | Wooster | 7 | 9,564(0.07%)#85 | 383,359(0.00%)#2,428 |
| 86. | Maumee | 7 | 9,564(0.07%)#86 | 383,359(0.00%)#2,439 |
| 87. | Loveland | 6 | 9,564(0.06%)#87 | 383,359(0.00%)#2,516 |
| 88. | Gates Mills | 6 | 9,564(0.06%)#88 | 383,359(0.00%)#2,544 |
| 89. | Maineville | 6 | 9,564(0.06%)#89 | 383,359(0.00%)#2,545 |
| 90. | Lisbon | 5 | 9,564(0.05%)#90 | 383,359(0.00%)#2,615 |
| 91. | Mcconnelsville | 5 | 9,564(0.05%)#91 | 383,359(0.00%)#2,618 |
| 92. | Valley View | 5 | 9,564(0.05%)#92 | 383,359(0.00%)#2,621 |
| 93. | Bratenahl | 4 | 9,564(0.04%)#93 | 383,359(0.00%)#2,693 |
| 94. | Kirtland Hills | 4 | 9,564(0.04%)#94 | 383,359(0.00%)#2,709 |
| 95. | South Vienna | 4 | 9,564(0.04%)#95 | 383,359(0.00%)#2,710 |
| 96. | Portage | 3 | 9,564(0.03%)#96 | 383,359(0.00%)#2,766 |
| 97. | Gettysburg | 1 | 9,564(0.01%)#97 | 383,359(0.00%)#2,856 |
| 98. | Catawba | 1 | 9,564(0.01%)#98 | 383,359(0.00%)#2,863 |
Common Questions
What are the Top 10 Cities with the Most Immigrants from Ukraine in Ohio?
Top 10 Cities with the Most Immigrants from Ukraine in Ohio are:
#1
1,506
#2
1,147
#3
871
#4
326
#5
312
#6
229
#7
225
#8
191
#9
178
#10
164
What city has the Most Immigrants from Ukraine in Ohio?
Parma has the Most Immigrants from Ukraine in Ohio with 1,506.
What is the Total Immigrants from Ukraine in the State of Ohio?
Total Immigrants from Ukraine in Ohio is 9,564.
What is the Total Immigrants from Ukraine in the United States?
Total Immigrants from Ukraine in the United States is 383,359.