Cities with the Highest Percentage of Portuguese Population in Idaho
RELATED REPORTS & OPTIONS
Portuguese
Idaho
Compare Cities
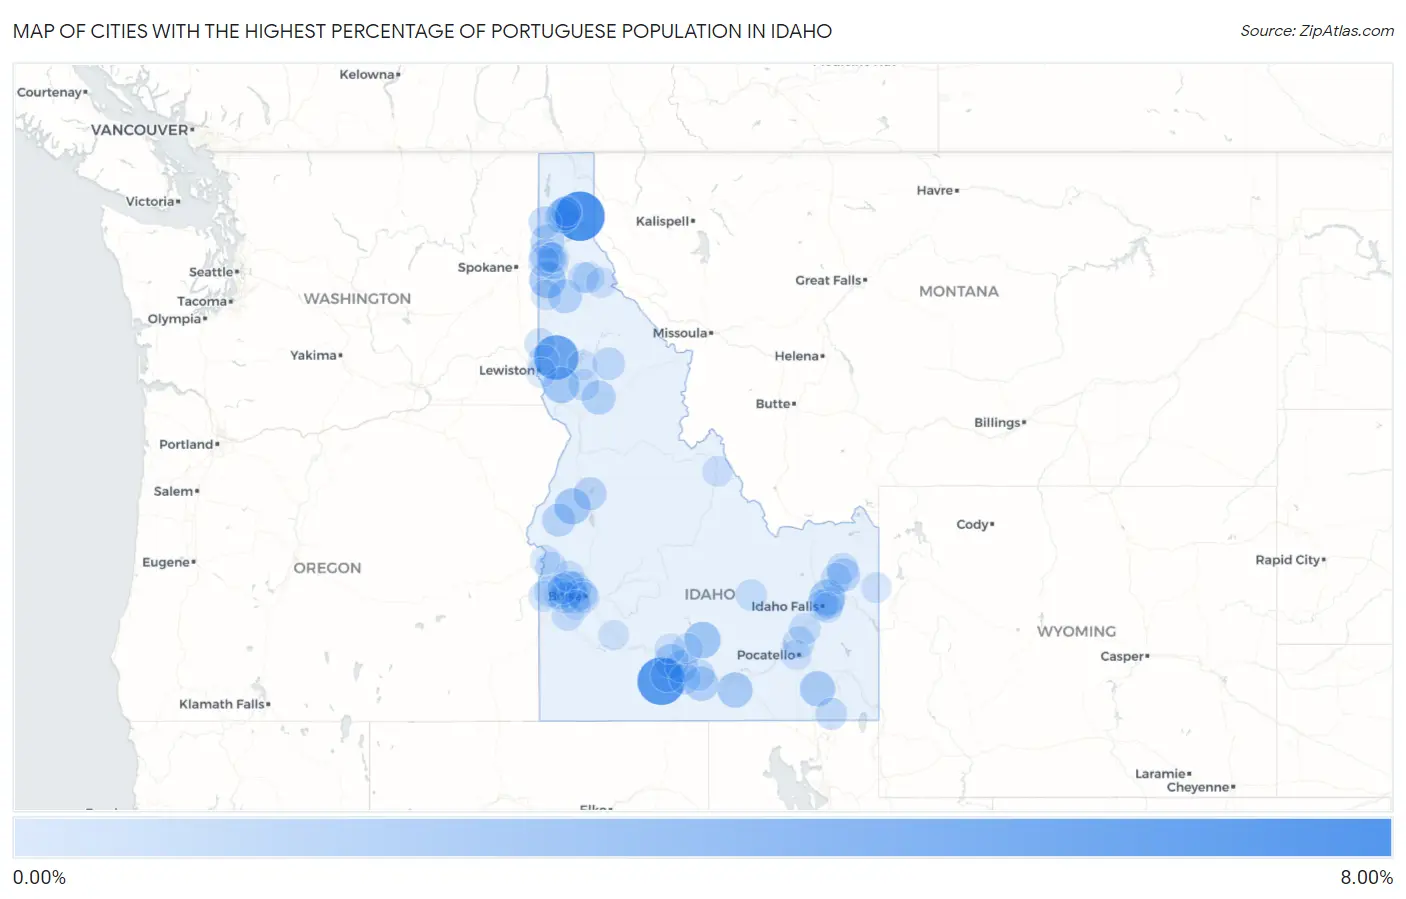
Map of Cities with the Highest Percentage of Portuguese Population in Idaho
0.00%
8.00%
Cities with the Highest Percentage of Portuguese Population in Idaho
| City | Portuguese | vs State | vs National | |
| 1. | Hope | 6.25% | 0.39%(+5.86)#1 | 0.41%(+5.84)#224 |
| 2. | Castleford | 5.61% | 0.39%(+5.23)#2 | 0.41%(+5.20)#271 |
| 3. | Juliaetta | 4.62% | 0.39%(+4.23)#3 | 0.41%(+4.21)#342 |
| 4. | Richfield | 1.96% | 0.39%(+1.58)#4 | 0.41%(+1.56)#917 |
| 5. | Rockford Bay | 1.96% | 0.39%(+1.57)#5 | 0.41%(+1.55)#919 |
| 6. | Winchester | 1.90% | 0.39%(+1.51)#6 | 0.41%(+1.49)#954 |
| 7. | Ucon | 1.84% | 0.39%(+1.45)#7 | 0.41%(+1.43)#995 |
| 8. | Council | 1.83% | 0.39%(+1.45)#8 | 0.41%(+1.42)#1,001 |
| 9. | Downey | 1.61% | 0.39%(+1.23)#9 | 0.41%(+1.20)#1,148 |
| 10. | Star | 1.61% | 0.39%(+1.23)#10 | 0.41%(+1.20)#1,149 |
| 11. | Albion | 1.60% | 0.39%(+1.21)#11 | 0.41%(+1.19)#1,158 |
| 12. | Wendell | 1.38% | 0.39%(+0.993)#12 | 0.41%(+0.971)#1,345 |
| 13. | Murtaugh | 1.30% | 0.39%(+0.912)#13 | 0.41%(+0.891)#1,432 |
| 14. | Buhl | 1.29% | 0.39%(+0.902)#14 | 0.41%(+0.881)#1,441 |
| 15. | Dover | 1.25% | 0.39%(+0.863)#15 | 0.41%(+0.842)#1,482 |
| 16. | Stites | 1.23% | 0.39%(+0.840)#16 | 0.41%(+0.819)#1,515 |
| 17. | St Maries | 1.20% | 0.39%(+0.817)#17 | 0.41%(+0.795)#1,539 |
| 18. | Spirit Lake | 1.09% | 0.39%(+0.708)#18 | 0.41%(+0.687)#1,683 |
| 19. | Sandpoint | 1.07% | 0.39%(+0.681)#19 | 0.41%(+0.659)#1,726 |
| 20. | Rathdrum | 1.02% | 0.39%(+0.628)#20 | 0.41%(+0.607)#1,814 |
| 21. | Cambridge | 0.92% | 0.39%(+0.534)#21 | 0.41%(+0.512)#1,969 |
| 22. | Mccall | 0.91% | 0.39%(+0.525)#22 | 0.41%(+0.503)#1,984 |
| 23. | Teton | 0.88% | 0.39%(+0.493)#23 | 0.41%(+0.472)#2,054 |
| 24. | Pierce | 0.77% | 0.39%(+0.387)#24 | 0.41%(+0.365)#2,278 |
| 25. | Eagle | 0.71% | 0.39%(+0.318)#25 | 0.41%(+0.297)#2,459 |
| 26. | Jerome | 0.71% | 0.39%(+0.318)#26 | 0.41%(+0.297)#2,460 |
| 27. | Priest River | 0.69% | 0.39%(+0.305)#27 | 0.41%(+0.283)#2,499 |
| 28. | Meridian | 0.64% | 0.39%(+0.249)#28 | 0.41%(+0.228)#2,649 |
| 29. | Fort Hall | 0.58% | 0.39%(+0.189)#29 | 0.41%(+0.167)#2,842 |
| 30. | Preston | 0.53% | 0.39%(+0.143)#30 | 0.41%(+0.121)#3,025 |
| 31. | Garden City | 0.53% | 0.39%(+0.142)#31 | 0.41%(+0.120)#3,028 |
| 32. | Iona | 0.51% | 0.39%(+0.123)#32 | 0.41%(+0.102)#3,096 |
| 33. | Eden | 0.51% | 0.39%(+0.118)#33 | 0.41%(+0.097)#3,114 |
| 34. | Melba | 0.50% | 0.39%(+0.112)#34 | 0.41%(+0.090)#3,136 |
| 35. | Nampa | 0.49% | 0.39%(+0.105)#35 | 0.41%(+0.083)#3,161 |
| 36. | New Plymouth | 0.49% | 0.39%(+0.100)#36 | 0.41%(+0.078)#3,184 |
| 37. | St Anthony | 0.46% | 0.39%(+0.069)#37 | 0.41%(+0.048)#3,333 |
| 38. | Caldwell | 0.45% | 0.39%(+0.066)#38 | 0.41%(+0.044)#3,349 |
| 39. | Twin Falls | 0.44% | 0.39%(+0.051)#39 | 0.41%(+0.030)#3,424 |
| 40. | Blackfoot | 0.43% | 0.39%(+0.043)#40 | 0.41%(+0.021)#3,475 |
| 41. | Idaho Falls | 0.41% | 0.39%(+0.023)#41 | 0.41%(+0.001)#3,569 |
| 42. | Greenleaf | 0.40% | 0.39%(+0.015)#42 | 0.41%(-0.006)#3,608 |
| 43. | Arco | 0.40% | 0.39%(+0.014)#43 | 0.41%(-0.008)#3,621 |
| 44. | Rexburg | 0.39% | 0.39%(+0.005)#44 | 0.41%(-0.016)#3,660 |
| 45. | Nezperce | 0.39% | 0.39%(-0.001)#45 | 0.41%(-0.022)#3,698 |
| 46. | Coeur D Alene | 0.38% | 0.39%(-0.006)#46 | 0.41%(-0.027)#3,726 |
| 47. | Moscow | 0.36% | 0.39%(-0.024)#47 | 0.41%(-0.045)#3,834 |
| 48. | Shoshone | 0.36% | 0.39%(-0.031)#48 | 0.41%(-0.052)#3,885 |
| 49. | Boise City | 0.35% | 0.39%(-0.033)#49 | 0.41%(-0.054)#3,890 |
| 50. | Emmett | 0.35% | 0.39%(-0.036)#50 | 0.41%(-0.057)#3,904 |
| 51. | Kellogg | 0.35% | 0.39%(-0.038)#51 | 0.41%(-0.059)#3,918 |
| 52. | Pinehurst | 0.30% | 0.39%(-0.086)#52 | 0.41%(-0.107)#4,245 |
| 53. | Hayden Lake | 0.26% | 0.39%(-0.127)#53 | 0.41%(-0.148)#4,582 |
| 54. | Post Falls | 0.25% | 0.39%(-0.137)#54 | 0.41%(-0.158)#4,682 |
| 55. | Genesee | 0.25% | 0.39%(-0.138)#55 | 0.41%(-0.160)#4,702 |
| 56. | Homedale | 0.21% | 0.39%(-0.182)#56 | 0.41%(-0.203)#5,134 |
| 57. | Wallace | 0.18% | 0.39%(-0.202)#57 | 0.41%(-0.223)#5,357 |
| 58. | Plummer | 0.17% | 0.39%(-0.214)#58 | 0.41%(-0.235)#5,482 |
| 59. | Ponderay | 0.17% | 0.39%(-0.221)#59 | 0.41%(-0.243)#5,573 |
| 60. | Salmon | 0.16% | 0.39%(-0.228)#60 | 0.41%(-0.249)#5,643 |
| 61. | Driggs | 0.16% | 0.39%(-0.230)#61 | 0.41%(-0.251)#5,660 |
| 62. | Ammon | 0.13% | 0.39%(-0.253)#62 | 0.41%(-0.274)#5,939 |
| 63. | Middleton | 0.11% | 0.39%(-0.272)#63 | 0.41%(-0.294)#6,171 |
| 64. | Pocatello | 0.092% | 0.39%(-0.295)#64 | 0.41%(-0.316)#6,416 |
| 65. | Lewiston | 0.088% | 0.39%(-0.299)#65 | 0.41%(-0.321)#6,465 |
| 66. | Orofino | 0.062% | 0.39%(-0.325)#66 | 0.41%(-0.347)#6,784 |
| 67. | Gooding | 0.054% | 0.39%(-0.332)#67 | 0.41%(-0.354)#6,856 |
| 68. | Kuna | 0.044% | 0.39%(-0.342)#68 | 0.41%(-0.364)#6,968 |
| 69. | Mountain Home | 0.044% | 0.39%(-0.343)#69 | 0.41%(-0.364)#6,976 |
| 70. | Hayden | 0.038% | 0.39%(-0.348)#70 | 0.41%(-0.370)#7,037 |
| 71. | Payette | 0.037% | 0.39%(-0.350)#71 | 0.41%(-0.371)#7,056 |
Common Questions
What are the Top 10 Cities with the Highest Percentage of Portuguese Population in Idaho?
Top 10 Cities with the Highest Percentage of Portuguese Population in Idaho are:
#1
6.25%
#2
5.61%
#3
4.62%
#4
1.96%
#5
1.96%
#6
1.90%
#7
1.84%
#8
1.83%
#9
1.61%
#10
1.61%
What city has the Highest Percentage of Portuguese Population in Idaho?
Hope has the Highest Percentage of Portuguese Population in Idaho with 6.25%.
What is the Percentage of Portuguese Population in the State of Idaho?
Percentage of Portuguese Population in Idaho is 0.39%.
What is the Percentage of Portuguese Population in the United States?
Percentage of Portuguese Population in the United States is 0.41%.