Cities with the Highest Percentage of Portuguese Population in Oklahoma
RELATED REPORTS & OPTIONS
Portuguese
Oklahoma
Compare Cities
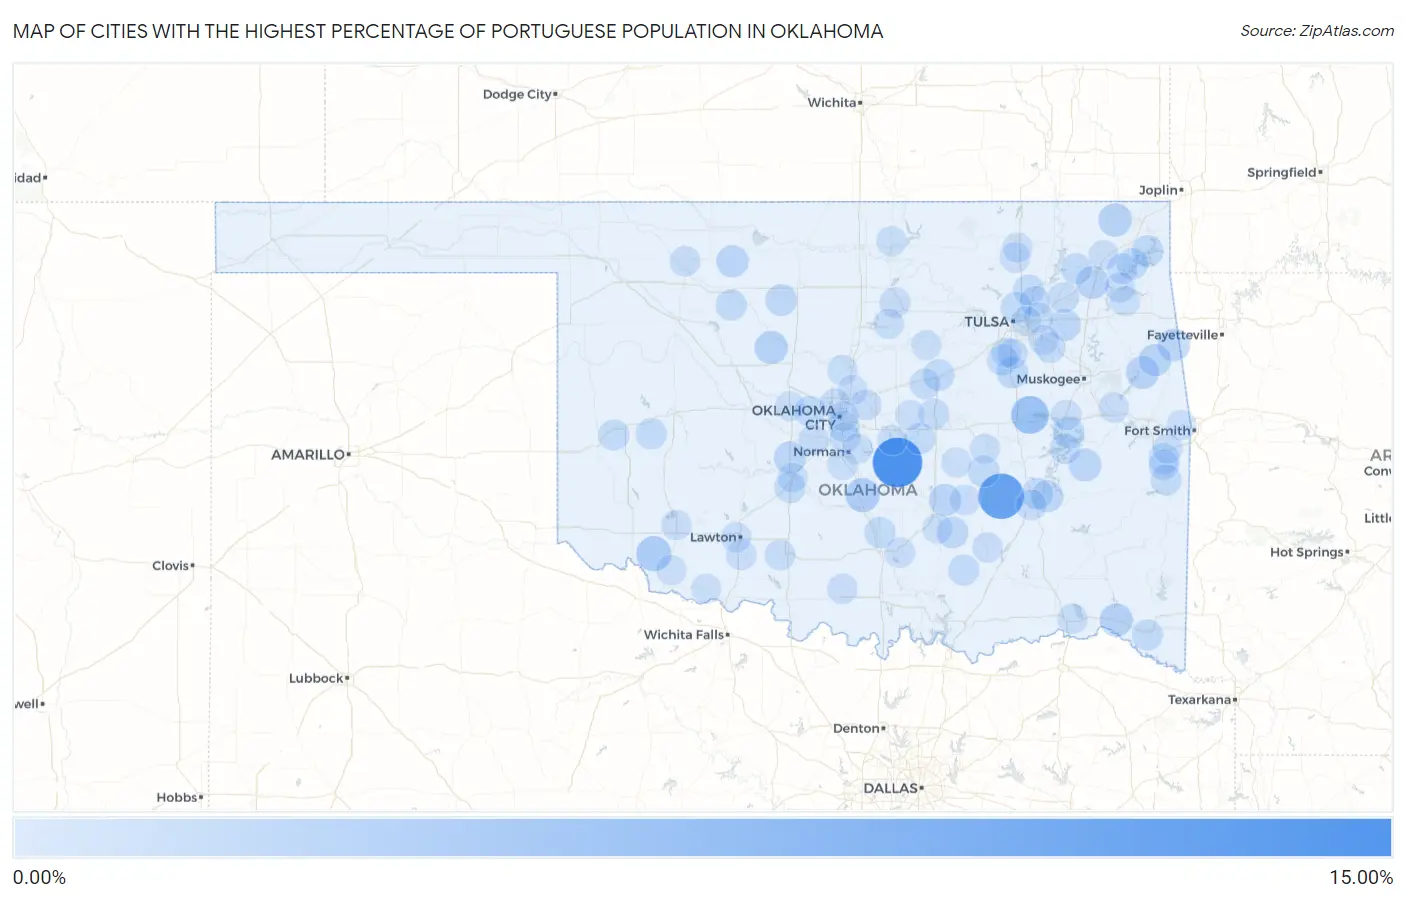
Map of Cities with the Highest Percentage of Portuguese Population in Oklahoma
0.00%
15.00%
Cities with the Highest Percentage of Portuguese Population in Oklahoma
| City | Portuguese | vs State | vs National | |
| 1. | Macomb | 11.11% | 0.14%(+11.0)#1 | 0.41%(+10.7)#91 |
| 2. | Stuart | 8.77% | 0.14%(+8.63)#2 | 0.41%(+8.36)#136 |
| 3. | Hennepin | 5.56% | 0.14%(+5.41)#3 | 0.41%(+5.15)#276 |
| 4. | Hoffman | 4.21% | 0.14%(+4.07)#4 | 0.41%(+3.80)#379 |
| 5. | Tipton | 2.74% | 0.14%(+2.60)#5 | 0.41%(+2.34)#637 |
| 6. | Wayne | 2.22% | 0.14%(+2.08)#6 | 0.41%(+1.81)#796 |
| 7. | Welch | 1.79% | 0.14%(+1.64)#7 | 0.41%(+1.38)#1,029 |
| 8. | Loyal | 1.79% | 0.14%(+1.64)#8 | 0.41%(+1.38)#1,030 |
| 9. | Valliant | 1.67% | 0.14%(+1.52)#9 | 0.41%(+1.26)#1,110 |
| 10. | Adair | 1.60% | 0.14%(+1.46)#10 | 0.41%(+1.19)#1,161 |
| 11. | Tenkiller | 1.60% | 0.14%(+1.45)#11 | 0.41%(+1.19)#1,163 |
| 12. | Quinton | 1.47% | 0.14%(+1.32)#12 | 0.41%(+1.06)#1,267 |
| 13. | Canadian Shores | 1.42% | 0.14%(+1.28)#13 | 0.41%(+1.02)#1,293 |
| 14. | Westville | 1.38% | 0.14%(+1.23)#14 | 0.41%(+0.967)#1,352 |
| 15. | Titanic | 1.30% | 0.14%(+1.15)#15 | 0.41%(+0.887)#1,433 |
| 16. | Carmen | 1.28% | 0.14%(+1.14)#16 | 0.41%(+0.870)#1,450 |
| 17. | Pocasset | 1.24% | 0.14%(+1.10)#17 | 0.41%(+0.834)#1,491 |
| 18. | Francis | 1.24% | 0.14%(+1.10)#18 | 0.41%(+0.830)#1,495 |
| 19. | Inola | 1.06% | 0.14%(+0.922)#19 | 0.41%(+0.656)#1,729 |
| 20. | Alderson | 1.02% | 0.14%(+0.878)#20 | 0.41%(+0.612)#1,803 |
| 21. | Copeland | 1.00% | 0.14%(+0.853)#21 | 0.41%(+0.588)#1,842 |
| 22. | Drummond | 0.97% | 0.14%(+0.828)#22 | 0.41%(+0.563)#1,892 |
| 23. | Winchester | 0.95% | 0.14%(+0.811)#23 | 0.41%(+0.546)#1,917 |
| 24. | Stonewall | 0.93% | 0.14%(+0.792)#24 | 0.41%(+0.526)#1,941 |
| 25. | Texanna | 0.87% | 0.14%(+0.729)#25 | 0.41%(+0.464)#2,072 |
| 26. | Horntown | 0.84% | 0.14%(+0.697)#26 | 0.41%(+0.432)#2,143 |
| 27. | Stroud | 0.84% | 0.14%(+0.694)#27 | 0.41%(+0.429)#2,153 |
| 28. | Mcalester | 0.82% | 0.14%(+0.674)#28 | 0.41%(+0.409)#2,187 |
| 29. | Burns Flat | 0.73% | 0.14%(+0.592)#29 | 0.41%(+0.326)#2,382 |
| 30. | Cleora | 0.73% | 0.14%(+0.587)#30 | 0.41%(+0.321)#2,390 |
| 31. | Ninnekah | 0.71% | 0.14%(+0.565)#31 | 0.41%(+0.300)#2,451 |
| 32. | Panama | 0.70% | 0.14%(+0.561)#32 | 0.41%(+0.296)#2,463 |
| 33. | Fairview | 0.70% | 0.14%(+0.560)#33 | 0.41%(+0.295)#2,466 |
| 34. | Turley | 0.69% | 0.14%(+0.543)#34 | 0.41%(+0.278)#2,515 |
| 35. | Chelsea | 0.68% | 0.14%(+0.536)#35 | 0.41%(+0.271)#2,533 |
| 36. | Wynnewood | 0.68% | 0.14%(+0.536)#36 | 0.41%(+0.271)#2,535 |
| 37. | Wapanucka | 0.67% | 0.14%(+0.524)#37 | 0.41%(+0.259)#2,564 |
| 38. | Idabel | 0.64% | 0.14%(+0.501)#38 | 0.41%(+0.235)#2,622 |
| 39. | Mounds | 0.64% | 0.14%(+0.494)#39 | 0.41%(+0.229)#2,643 |
| 40. | Valley Brook | 0.62% | 0.14%(+0.477)#40 | 0.41%(+0.212)#2,695 |
| 41. | Poteau | 0.61% | 0.14%(+0.467)#41 | 0.41%(+0.202)#2,719 |
| 42. | Collinsville | 0.61% | 0.14%(+0.464)#42 | 0.41%(+0.199)#2,729 |
| 43. | Earlsboro | 0.61% | 0.14%(+0.463)#43 | 0.41%(+0.198)#2,732 |
| 44. | Yukon | 0.58% | 0.14%(+0.440)#44 | 0.41%(+0.175)#2,817 |
| 45. | Elk City | 0.57% | 0.14%(+0.423)#45 | 0.41%(+0.157)#2,883 |
| 46. | Prague | 0.53% | 0.14%(+0.387)#46 | 0.41%(+0.122)#3,020 |
| 47. | Longtown | 0.46% | 0.14%(+0.320)#47 | 0.41%(+0.055)#3,295 |
| 48. | Davenport | 0.44% | 0.14%(+0.294)#48 | 0.41%(+0.029)#3,428 |
| 49. | Morrison | 0.43% | 0.14%(+0.286)#49 | 0.41%(+0.021)#3,476 |
| 50. | Waynoka | 0.39% | 0.14%(+0.252)#50 | 0.41%(-0.013)#3,648 |
| 51. | Empire City | 0.39% | 0.14%(+0.251)#51 | 0.41%(-0.014)#3,650 |
| 52. | Coweta | 0.39% | 0.14%(+0.251)#52 | 0.41%(-0.014)#3,652 |
| 53. | Claremore | 0.39% | 0.14%(+0.242)#53 | 0.41%(-0.023)#3,701 |
| 54. | Savanna | 0.38% | 0.14%(+0.232)#55 | 0.41%(-0.033)#3,757 |
| 55. | Ketchum | 0.38% | 0.14%(+0.232)#56 | 0.41%(-0.033)#3,758 |
| 56. | Tuttle | 0.37% | 0.14%(+0.229)#57 | 0.41%(-0.036)#3,782 |
| 57. | Owasso | 0.36% | 0.14%(+0.219)#58 | 0.41%(-0.046)#3,839 |
| 58. | Geronimo | 0.34% | 0.14%(+0.193)#59 | 0.41%(-0.072)#4,008 |
| 59. | Ochelata | 0.33% | 0.14%(+0.184)#60 | 0.41%(-0.081)#4,078 |
| 60. | Checotah | 0.30% | 0.14%(+0.152)#61 | 0.41%(-0.113)#4,292 |
| 61. | Shady Point | 0.28% | 0.14%(+0.136)#62 | 0.41%(-0.129)#4,412 |
| 62. | Mountain Park | 0.28% | 0.14%(+0.133)#63 | 0.41%(-0.133)#4,436 |
| 63. | Gore | 0.27% | 0.14%(+0.123)#64 | 0.41%(-0.142)#4,526 |
| 64. | Sulphur | 0.26% | 0.14%(+0.116)#65 | 0.41%(-0.149)#4,590 |
| 65. | Healdton | 0.25% | 0.14%(+0.111)#66 | 0.41%(-0.154)#4,636 |
| 66. | Jones | 0.24% | 0.14%(+0.096)#67 | 0.41%(-0.169)#4,783 |
| 67. | Stillwater | 0.24% | 0.14%(+0.094)#68 | 0.41%(-0.172)#4,815 |
| 68. | Spavinaw | 0.24% | 0.14%(+0.094)#69 | 0.41%(-0.172)#4,816 |
| 69. | Moore | 0.23% | 0.14%(+0.092)#70 | 0.41%(-0.174)#4,831 |
| 70. | Ponca City | 0.22% | 0.14%(+0.074)#71 | 0.41%(-0.191)#5,008 |
| 71. | Norman | 0.22% | 0.14%(+0.072)#72 | 0.41%(-0.193)#5,023 |
| 72. | Allen | 0.22% | 0.14%(+0.072)#73 | 0.41%(-0.193)#5,027 |
| 73. | Hugo | 0.21% | 0.14%(+0.070)#74 | 0.41%(-0.196)#5,053 |
| 74. | Coalgate | 0.21% | 0.14%(+0.069)#75 | 0.41%(-0.196)#5,058 |
| 75. | Lawton | 0.21% | 0.14%(+0.065)#76 | 0.41%(-0.200)#5,103 |
| 76. | Guthrie | 0.20% | 0.14%(+0.060)#77 | 0.41%(-0.206)#5,165 |
| 77. | Glenpool | 0.20% | 0.14%(+0.054)#78 | 0.41%(-0.211)#5,215 |
| 78. | Bethel Acres | 0.20% | 0.14%(+0.053)#79 | 0.41%(-0.212)#5,233 |
| 79. | The Village | 0.19% | 0.14%(+0.047)#80 | 0.41%(-0.218)#5,294 |
| 80. | Catoosa | 0.18% | 0.14%(+0.039)#81 | 0.41%(-0.226)#5,385 |
| 81. | Goldsby | 0.18% | 0.14%(+0.039)#82 | 0.41%(-0.226)#5,387 |
| 82. | Edmond | 0.18% | 0.14%(+0.035)#83 | 0.41%(-0.230)#5,429 |
| 83. | El Reno | 0.18% | 0.14%(+0.035)#84 | 0.41%(-0.231)#5,434 |
| 84. | Ada | 0.18% | 0.14%(+0.033)#85 | 0.41%(-0.233)#5,451 |
| 85. | Tulsa | 0.17% | 0.14%(+0.030)#86 | 0.41%(-0.235)#5,479 |
| 86. | Frederick | 0.17% | 0.14%(+0.029)#87 | 0.41%(-0.236)#5,489 |
| 87. | Oklahoma City | 0.17% | 0.14%(+0.026)#88 | 0.41%(-0.239)#5,535 |
| 88. | Wewoka | 0.16% | 0.14%(+0.017)#89 | 0.41%(-0.248)#5,626 |
| 89. | Kenwood | 0.16% | 0.14%(+0.014)#90 | 0.41%(-0.252)#5,666 |
| 90. | Cushing | 0.16% | 0.14%(+0.013)#91 | 0.41%(-0.252)#5,673 |
| 91. | Meeker | 0.15% | 0.14%(+0.012)#92 | 0.41%(-0.253)#5,692 |
| 92. | Broken Arrow | 0.15% | 0.14%(+0.004)#93 | 0.41%(-0.261)#5,779 |
| 93. | Roland | 0.15% | 0.14%(+0.004)#94 | 0.41%(-0.261)#5,787 |
| 94. | Wetumka | 0.13% | 0.14%(-0.009)#95 | 0.41%(-0.275)#5,944 |
| 95. | Kiefer | 0.13% | 0.14%(-0.012)#96 | 0.41%(-0.277)#5,967 |
| 96. | Grandfield | 0.11% | 0.14%(-0.033)#97 | 0.41%(-0.298)#6,213 |
| 97. | Bartlesville | 0.11% | 0.14%(-0.036)#98 | 0.41%(-0.301)#6,242 |
| 98. | Vinita | 0.096% | 0.14%(-0.047)#99 | 0.41%(-0.312)#6,363 |
| 99. | Spiro | 0.095% | 0.14%(-0.047)#100 | 0.41%(-0.313)#6,373 |
| 100. | Chickasha | 0.092% | 0.14%(-0.050)#101 | 0.41%(-0.316)#6,409 |
Common Questions
What are the Top 10 Cities with the Highest Percentage of Portuguese Population in Oklahoma?
Top 10 Cities with the Highest Percentage of Portuguese Population in Oklahoma are:
What city has the Highest Percentage of Portuguese Population in Oklahoma?
Macomb has the Highest Percentage of Portuguese Population in Oklahoma with 11.11%.
What is the Percentage of Portuguese Population in the State of Oklahoma?
Percentage of Portuguese Population in Oklahoma is 0.14%.
What is the Percentage of Portuguese Population in the United States?
Percentage of Portuguese Population in the United States is 0.41%.