Cities with the Highest Percentage of Portuguese Population in Massachusetts
RELATED REPORTS & OPTIONS
Portuguese
Massachusetts
Compare Cities
Map of Cities with the Highest Percentage of Portuguese Population in Massachusetts
0.00%
50.00%
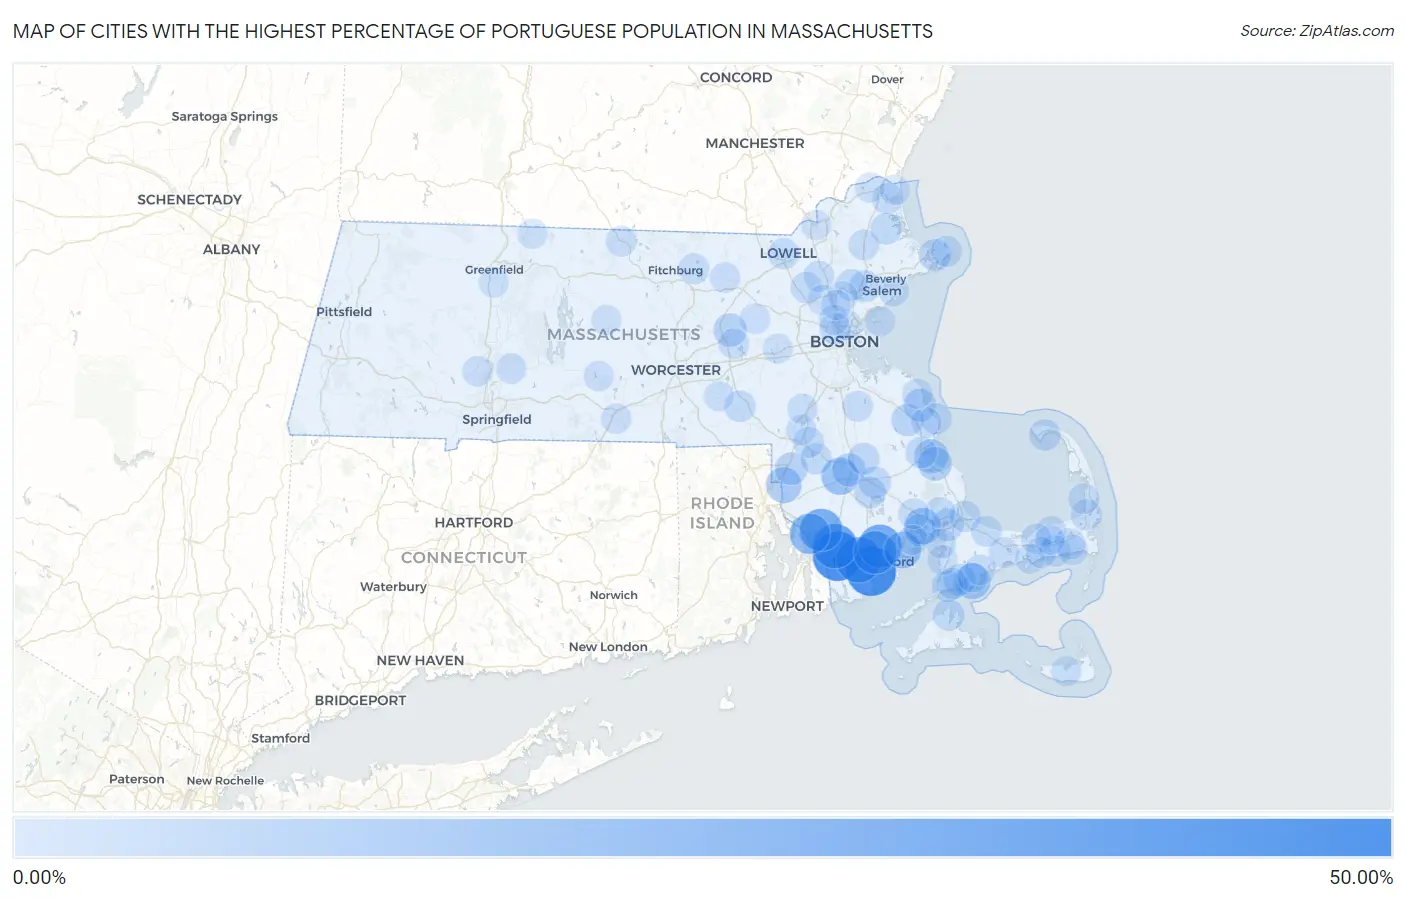
Cities with the Highest Percentage of Portuguese Population in Massachusetts
| City | Portuguese | vs State | vs National | |
| 1. | Bliss Corner | 48.56% | 3.85%(+44.7)#1 | 0.41%(+48.2)#5 |
| 2. | North Westport | 48.18% | 3.85%(+44.3)#2 | 0.41%(+47.8)#6 |
| 3. | Smith Mills | 38.59% | 3.85%(+34.7)#3 | 0.41%(+38.2)#8 |
| 4. | Fall River | 36.09% | 3.85%(+32.2)#4 | 0.41%(+35.7)#10 |
| 5. | Acushnet Center | 33.57% | 3.85%(+29.7)#5 | 0.41%(+33.2)#11 |
| 6. | New Bedford | 32.57% | 3.85%(+28.7)#6 | 0.41%(+32.2)#13 |
| 7. | Somerset | 31.48% | 3.85%(+27.6)#7 | 0.41%(+31.1)#15 |
| 8. | Ocean Grove | 26.27% | 3.85%(+22.4)#8 | 0.41%(+25.9)#22 |
| 9. | Taunton | 18.70% | 3.85%(+14.9)#9 | 0.41%(+18.3)#39 |
| 10. | Mattapoisett Center | 18.07% | 3.85%(+14.2)#10 | 0.41%(+17.7)#42 |
| 11. | Wareham Center | 16.73% | 3.85%(+12.9)#11 | 0.41%(+16.3)#47 |
| 12. | Monomoscoy Island | 15.45% | 3.85%(+11.6)#12 | 0.41%(+15.0)#53 |
| 13. | Oak Bluffs | 14.46% | 3.85%(+10.6)#13 | 0.41%(+14.1)#60 |
| 14. | North Seekonk | 14.42% | 3.85%(+10.6)#14 | 0.41%(+14.0)#61 |
| 15. | North Plymouth | 11.48% | 3.85%(+7.62)#15 | 0.41%(+11.1)#84 |
| 16. | Plymouth | 10.73% | 3.85%(+6.88)#16 | 0.41%(+10.3)#97 |
| 17. | Hudson | 9.33% | 3.85%(+5.48)#17 | 0.41%(+8.92)#122 |
| 18. | Raynham Center | 9.14% | 3.85%(+5.29)#18 | 0.41%(+8.74)#126 |
| 19. | Attleboro | 7.96% | 3.85%(+4.10)#19 | 0.41%(+7.55)#152 |
| 20. | Marshfield Hills | 7.85% | 3.85%(+4.00)#20 | 0.41%(+7.44)#159 |
| 21. | North Pembroke | 7.54% | 3.85%(+3.68)#21 | 0.41%(+7.13)#167 |
| 22. | Gloucester | 7.03% | 3.85%(+3.18)#22 | 0.41%(+6.62)#186 |
| 23. | Buzzards Bay | 6.72% | 3.85%(+2.86)#23 | 0.41%(+6.31)#197 |
| 24. | East Falmouth | 6.39% | 3.85%(+2.54)#24 | 0.41%(+5.98)#217 |
| 25. | Middleborough Center | 6.26% | 3.85%(+2.41)#25 | 0.41%(+5.86)#222 |
| 26. | North Lakeville | 6.19% | 3.85%(+2.34)#26 | 0.41%(+5.78)#228 |
| 27. | Weweantic | 6.15% | 3.85%(+2.30)#27 | 0.41%(+5.74)#231 |
| 28. | Provincetown | 5.74% | 3.85%(+1.89)#28 | 0.41%(+5.33)#259 |
| 29. | Bridgewater Town | 5.74% | 3.85%(+1.89)#29 | 0.41%(+5.33)#260 |
| 30. | Peabody | 5.73% | 3.85%(+1.88)#30 | 0.41%(+5.32)#262 |
| 31. | Falmouth | 5.56% | 3.85%(+1.71)#31 | 0.41%(+5.15)#275 |
| 32. | Rowley | 5.48% | 3.85%(+1.63)#32 | 0.41%(+5.07)#281 |
| 33. | Kingston | 5.45% | 3.85%(+1.60)#33 | 0.41%(+5.04)#283 |
| 34. | Vineyard Haven | 5.41% | 3.85%(+1.56)#34 | 0.41%(+5.00)#285 |
| 35. | Lynnfield | 5.37% | 3.85%(+1.52)#35 | 0.41%(+4.96)#290 |
| 36. | Milford | 5.20% | 3.85%(+1.35)#36 | 0.41%(+4.79)#300 |
| 37. | Teaticket | 5.12% | 3.85%(+1.27)#37 | 0.41%(+4.72)#307 |
| 38. | Sagamore | 5.07% | 3.85%(+1.22)#38 | 0.41%(+4.66)#311 |
| 39. | Norton Center | 4.96% | 3.85%(+1.11)#39 | 0.41%(+4.55)#315 |
| 40. | North Attleborough | 4.79% | 3.85%(+0.938)#40 | 0.41%(+4.38)#327 |
| 41. | West Warren | 4.72% | 3.85%(+0.869)#41 | 0.41%(+4.31)#332 |
| 42. | Pinehurst | 4.67% | 3.85%(+0.816)#42 | 0.41%(+4.26)#336 |
| 43. | Lowell | 4.64% | 3.85%(+0.791)#43 | 0.41%(+4.24)#340 |
| 44. | Somerville | 4.57% | 3.85%(+0.721)#44 | 0.41%(+4.17)#347 |
| 45. | Rockport | 4.25% | 3.85%(+0.396)#45 | 0.41%(+3.84)#375 |
| 46. | Ocean Bluff Brant Rock | 4.23% | 3.85%(+0.374)#46 | 0.41%(+3.82)#377 |
| 47. | Mansfield Center | 4.14% | 3.85%(+0.283)#47 | 0.41%(+3.73)#386 |
| 48. | Dennis Port | 4.06% | 3.85%(+0.208)#48 | 0.41%(+3.65)#401 |
| 49. | White Island Shores | 4.05% | 3.85%(+0.196)#49 | 0.41%(+3.64)#404 |
| 50. | East Sandwich | 4.01% | 3.85%(+0.161)#50 | 0.41%(+3.61)#407 |
| 51. | West Wareham | 3.92% | 3.85%(+0.063)#51 | 0.41%(+3.51)#418 |
| 52. | Lunenburg | 3.91% | 3.85%(+0.056)#52 | 0.41%(+3.50)#419 |
| 53. | Wilmington | 3.87% | 3.85%(+0.015)#53 | 0.41%(+3.46)#425 |
| 54. | Barnstable Town | 3.86% | 3.85%(+0.011)#54 | 0.41%(+3.46)#426 |
| 55. | Orleans | 3.72% | 3.85%(-0.129)#55 | 0.41%(+3.32)#441 |
| 56. | Newburyport | 3.72% | 3.85%(-0.132)#56 | 0.41%(+3.31)#443 |
| 57. | Harwich Center | 3.66% | 3.85%(-0.188)#57 | 0.41%(+3.26)#448 |
| 58. | Holbrook | 3.65% | 3.85%(-0.201)#58 | 0.41%(+3.24)#451 |
| 59. | North Eastham | 3.40% | 3.85%(-0.453)#59 | 0.41%(+2.99)#483 |
| 60. | East Dennis | 3.37% | 3.85%(-0.484)#60 | 0.41%(+2.96)#488 |
| 61. | Marlborough | 3.34% | 3.85%(-0.514)#61 | 0.41%(+2.93)#494 |
| 62. | Boxford | 3.32% | 3.85%(-0.536)#62 | 0.41%(+2.91)#499 |
| 63. | South Yarmouth | 3.30% | 3.85%(-0.549)#63 | 0.41%(+2.90)#505 |
| 64. | Winchendon | 3.25% | 3.85%(-0.602)#64 | 0.41%(+2.84)#510 |
| 65. | Mashpee Neck | 3.07% | 3.85%(-0.782)#65 | 0.41%(+2.66)#549 |
| 66. | Cedar Crest | 3.01% | 3.85%(-0.844)#66 | 0.41%(+2.60)#566 |
| 67. | Yarmouth Port | 3.00% | 3.85%(-0.855)#67 | 0.41%(+2.59)#570 |
| 68. | Ayer | 2.96% | 3.85%(-0.889)#68 | 0.41%(+2.56)#580 |
| 69. | Woburn | 2.90% | 3.85%(-0.950)#69 | 0.41%(+2.49)#595 |
| 70. | Marion Center | 2.86% | 3.85%(-0.995)#70 | 0.41%(+2.45)#608 |
| 71. | Maynard | 2.78% | 3.85%(-1.07)#71 | 0.41%(+2.38)#623 |
| 72. | Easthampton Town | 2.75% | 3.85%(-1.11)#72 | 0.41%(+2.34)#634 |
| 73. | Foxborough | 2.72% | 3.85%(-1.13)#73 | 0.41%(+2.32)#643 |
| 74. | Granby | 2.72% | 3.85%(-1.13)#74 | 0.41%(+2.31)#644 |
| 75. | North Falmouth | 2.72% | 3.85%(-1.13)#75 | 0.41%(+2.31)#647 |
| 76. | West Brookfield | 2.68% | 3.85%(-1.18)#76 | 0.41%(+2.27)#659 |
| 77. | Everett | 2.66% | 3.85%(-1.20)#77 | 0.41%(+2.25)#664 |
| 78. | Sturbridge | 2.66% | 3.85%(-1.20)#78 | 0.41%(+2.25)#665 |
| 79. | Harwich Port | 2.62% | 3.85%(-1.23)#79 | 0.41%(+2.21)#670 |
| 80. | Marshfield | 2.61% | 3.85%(-1.24)#80 | 0.41%(+2.20)#674 |
| 81. | Salem | 2.58% | 3.85%(-1.28)#81 | 0.41%(+2.17)#682 |
| 82. | Walpole | 2.54% | 3.85%(-1.31)#82 | 0.41%(+2.13)#696 |
| 83. | Nantucket | 2.54% | 3.85%(-1.31)#83 | 0.41%(+2.13)#697 |
| 84. | Scituate | 2.52% | 3.85%(-1.34)#84 | 0.41%(+2.11)#701 |
| 85. | Medford | 2.50% | 3.85%(-1.36)#85 | 0.41%(+2.09)#705 |
| 86. | Wakefield | 2.40% | 3.85%(-1.45)#86 | 0.41%(+1.99)#732 |
| 87. | Barre | 2.36% | 3.85%(-1.50)#87 | 0.41%(+1.95)#749 |
| 88. | Stoneham | 2.28% | 3.85%(-1.57)#88 | 0.41%(+1.87)#778 |
| 89. | Upton | 2.27% | 3.85%(-1.58)#89 | 0.41%(+1.86)#780 |
| 90. | Methuen Town | 2.27% | 3.85%(-1.58)#90 | 0.41%(+1.86)#782 |
| 91. | Deerfield | 2.26% | 3.85%(-1.59)#91 | 0.41%(+1.86)#784 |
| 92. | Amesbury Town | 2.20% | 3.85%(-1.65)#92 | 0.41%(+1.80)#807 |
| 93. | Northfield | 2.20% | 3.85%(-1.65)#93 | 0.41%(+1.79)#808 |
| 94. | Seabrook | 2.18% | 3.85%(-1.67)#94 | 0.41%(+1.78)#822 |
| 95. | South Dennis | 2.16% | 3.85%(-1.69)#95 | 0.41%(+1.75)#835 |
| 96. | West Yarmouth | 2.13% | 3.85%(-1.72)#96 | 0.41%(+1.72)#846 |
| 97. | Salisbury | 2.11% | 3.85%(-1.75)#97 | 0.41%(+1.70)#858 |
| 98. | Nahant | 2.10% | 3.85%(-1.75)#98 | 0.41%(+1.69)#865 |
| 99. | Cochituate | 2.05% | 3.85%(-1.81)#99 | 0.41%(+1.64)#890 |
| 100. | Pocasset | 2.02% | 3.85%(-1.84)#100 | 0.41%(+1.61)#898 |
Common Questions
What are the Top 10 Cities with the Highest Percentage of Portuguese Population in Massachusetts?
Top 10 Cities with the Highest Percentage of Portuguese Population in Massachusetts are:
#1
48.56%
#2
48.18%
#3
38.59%
#4
36.09%
#5
33.57%
#6
32.57%
#7
31.48%
#8
26.27%
#9
18.70%
#10
18.07%
What city has the Highest Percentage of Portuguese Population in Massachusetts?
Bliss Corner has the Highest Percentage of Portuguese Population in Massachusetts with 48.56%.
What is the Percentage of Portuguese Population in the State of Massachusetts?
Percentage of Portuguese Population in Massachusetts is 3.85%.
What is the Percentage of Portuguese Population in the United States?
Percentage of Portuguese Population in the United States is 0.41%.