Zip Codes with the Highest Percentage of Immigrants from South Central Asia in New Jersey
RELATED REPORTS & OPTIONS
South Central Asia
New Jersey
Compare Zip Codes
Map of Zip Codes with the Highest Percentage of Immigrants from South Central Asia in New Jersey
0.00%
40.00%
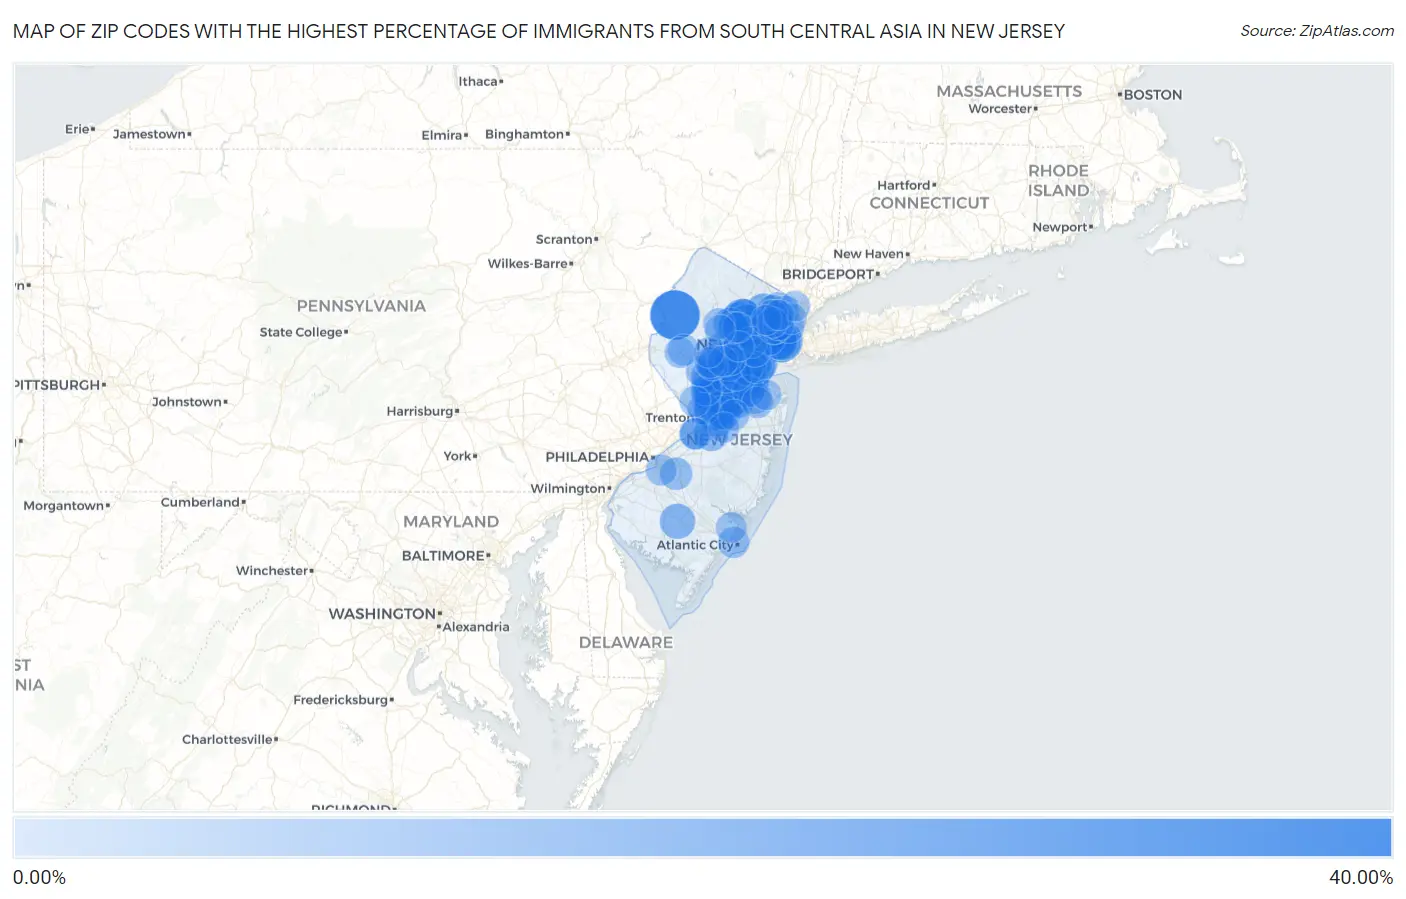
Zip Codes with the Highest Percentage of Immigrants from South Central Asia in New Jersey
| Zip Code | South Central Asia | vs State | vs National | |
| 1. | 07844 | 39.42% | 3.62%(+35.8)#1 | 1.31%(+38.1)#3 |
| 2. | 08830 | 38.78% | 3.62%(+35.2)#2 | 1.31%(+37.5)#4 |
| 3. | 08820 | 37.56% | 3.62%(+33.9)#3 | 1.31%(+36.3)#5 |
| 4. | 08536 | 35.50% | 3.62%(+31.9)#4 | 1.31%(+34.2)#8 |
| 5. | 08810 | 31.85% | 3.62%(+28.2)#5 | 1.31%(+30.5)#12 |
| 6. | 08852 | 30.21% | 3.62%(+26.6)#6 | 1.31%(+28.9)#13 |
| 7. | 07310 | 26.17% | 3.62%(+22.6)#7 | 1.31%(+24.9)#18 |
| 8. | 08550 | 26.00% | 3.62%(+22.4)#8 | 1.31%(+24.7)#19 |
| 9. | 08823 | 24.94% | 3.62%(+21.3)#9 | 1.31%(+23.6)#23 |
| 10. | 07054 | 23.81% | 3.62%(+20.2)#10 | 1.31%(+22.5)#26 |
| 11. | 08817 | 21.36% | 3.62%(+17.7)#11 | 1.31%(+20.1)#36 |
| 12. | 07034 | 21.34% | 3.62%(+17.7)#12 | 1.31%(+20.0)#38 |
| 13. | 08837 | 20.46% | 3.62%(+16.8)#13 | 1.31%(+19.1)#46 |
| 14. | 08824 | 19.69% | 3.62%(+16.1)#14 | 1.31%(+18.4)#50 |
| 15. | 08502 | 19.42% | 3.62%(+15.8)#15 | 1.31%(+18.1)#51 |
| 16. | 07306 | 19.12% | 3.62%(+15.5)#16 | 1.31%(+17.8)#53 |
| 17. | 07094 | 17.78% | 3.62%(+14.2)#17 | 1.31%(+16.5)#61 |
| 18. | 07502 | 17.64% | 3.62%(+14.0)#18 | 1.31%(+16.3)#62 |
| 19. | 07307 | 16.45% | 3.62%(+12.8)#19 | 1.31%(+15.1)#75 |
| 20. | 07008 | 15.99% | 3.62%(+12.4)#20 | 1.31%(+14.7)#79 |
| 21. | 08854 | 15.41% | 3.62%(+11.8)#21 | 1.31%(+14.1)#86 |
| 22. | 07311 | 14.17% | 3.62%(+10.6)#22 | 1.31%(+12.9)#101 |
| 23. | 08902 | 13.57% | 3.62%(+9.95)#23 | 1.31%(+12.3)#111 |
| 24. | 07001 | 13.26% | 3.62%(+9.64)#24 | 1.31%(+12.0)#117 |
| 25. | 08540 | 13.26% | 3.62%(+9.64)#25 | 1.31%(+12.0)#118 |
| 26. | 08341 | 13.21% | 3.62%(+9.59)#26 | 1.31%(+11.9)#121 |
| 27. | 08859 | 13.00% | 3.62%(+9.38)#27 | 1.31%(+11.7)#127 |
| 28. | 07302 | 12.67% | 3.62%(+9.05)#28 | 1.31%(+11.4)#138 |
| 29. | 08691 | 12.02% | 3.62%(+8.40)#29 | 1.31%(+10.7)#151 |
| 30. | 08512 | 12.01% | 3.62%(+8.39)#30 | 1.31%(+10.7)#152 |
| 31. | 08515 | 11.95% | 3.62%(+8.33)#31 | 1.31%(+10.6)#154 |
| 32. | 08816 | 11.78% | 3.62%(+8.15)#32 | 1.31%(+10.5)#162 |
| 33. | 07095 | 11.48% | 3.62%(+7.86)#33 | 1.31%(+10.2)#174 |
| 34. | 08520 | 11.33% | 3.62%(+7.71)#34 | 1.31%(+10.0)#175 |
| 35. | 08807 | 11.31% | 3.62%(+7.69)#35 | 1.31%(+10.0)#176 |
| 36. | 07058 | 10.69% | 3.62%(+7.07)#36 | 1.31%(+9.38)#193 |
| 37. | 08831 | 10.31% | 3.62%(+6.69)#37 | 1.31%(+9.00)#207 |
| 38. | 07078 | 10.29% | 3.62%(+6.67)#38 | 1.31%(+8.98)#210 |
| 39. | 08844 | 9.41% | 3.62%(+5.79)#39 | 1.31%(+8.10)#252 |
| 40. | 07029 | 9.29% | 3.62%(+5.67)#40 | 1.31%(+7.98)#256 |
| 41. | 08872 | 9.22% | 3.62%(+5.60)#41 | 1.31%(+7.92)#259 |
| 42. | 08873 | 8.91% | 3.62%(+5.29)#42 | 1.31%(+7.60)#278 |
| 43. | 07067 | 8.85% | 3.62%(+5.23)#43 | 1.31%(+7.54)#281 |
| 44. | 07751 | 8.63% | 3.62%(+5.01)#44 | 1.31%(+7.33)#298 |
| 45. | 07080 | 8.62% | 3.62%(+5.00)#45 | 1.31%(+7.31)#301 |
| 46. | 08863 | 8.48% | 3.62%(+4.86)#46 | 1.31%(+7.17)#315 |
| 47. | 07652 | 8.42% | 3.62%(+4.80)#47 | 1.31%(+7.11)#320 |
| 48. | 07950 | 8.39% | 3.62%(+4.77)#48 | 1.31%(+7.08)#322 |
| 49. | 07073 | 8.29% | 3.62%(+4.67)#49 | 1.31%(+6.99)#332 |
| 50. | 08043 | 8.15% | 3.62%(+4.53)#50 | 1.31%(+6.84)#336 |
| 51. | 07039 | 8.06% | 3.62%(+4.44)#51 | 1.31%(+6.75)#341 |
| 52. | 07920 | 7.99% | 3.62%(+4.37)#52 | 1.31%(+6.68)#349 |
| 53. | 08840 | 7.88% | 3.62%(+4.26)#53 | 1.31%(+6.57)#355 |
| 54. | 08554 | 7.53% | 3.62%(+3.91)#54 | 1.31%(+6.22)#379 |
| 55. | 07045 | 7.50% | 3.62%(+3.88)#55 | 1.31%(+6.19)#382 |
| 56. | 08846 | 7.09% | 3.62%(+3.47)#56 | 1.31%(+5.78)#406 |
| 57. | 07012 | 7.03% | 3.62%(+3.41)#57 | 1.31%(+5.72)#409 |
| 58. | 08648 | 6.90% | 3.62%(+3.28)#58 | 1.31%(+5.59)#418 |
| 59. | 08857 | 6.74% | 3.62%(+3.12)#59 | 1.31%(+5.43)#435 |
| 60. | 08904 | 6.57% | 3.62%(+2.95)#60 | 1.31%(+5.26)#451 |
| 61. | 07077 | 6.49% | 3.62%(+2.87)#61 | 1.31%(+5.19)#459 |
| 62. | 07041 | 5.92% | 3.62%(+2.30)#62 | 1.31%(+4.61)#519 |
| 63. | 07204 | 5.92% | 3.62%(+2.29)#63 | 1.31%(+4.61)#521 |
| 64. | 08558 | 5.87% | 3.62%(+2.25)#64 | 1.31%(+4.56)#525 |
| 65. | 08829 | 5.86% | 3.62%(+2.24)#65 | 1.31%(+4.56)#526 |
| 66. | 08401 | 5.86% | 3.62%(+2.24)#66 | 1.31%(+4.55)#528 |
| 67. | 07059 | 5.86% | 3.62%(+2.23)#67 | 1.31%(+4.55)#529 |
| 68. | 07070 | 5.82% | 3.62%(+2.20)#68 | 1.31%(+4.51)#532 |
| 69. | 07746 | 5.80% | 3.62%(+2.18)#69 | 1.31%(+4.49)#536 |
| 70. | 08518 | 5.80% | 3.62%(+2.17)#70 | 1.31%(+4.49)#537 |
| 71. | 08812 | 5.78% | 3.62%(+2.16)#71 | 1.31%(+4.48)#539 |
| 72. | 07020 | 5.75% | 3.62%(+2.13)#72 | 1.31%(+4.44)#543 |
| 73. | 07927 | 5.55% | 3.62%(+1.93)#73 | 1.31%(+4.24)#578 |
| 74. | 08031 | 5.53% | 3.62%(+1.91)#74 | 1.31%(+4.22)#580 |
| 75. | 07646 | 5.50% | 3.62%(+1.87)#75 | 1.31%(+4.19)#585 |
| 76. | 08535 | 5.44% | 3.62%(+1.82)#76 | 1.31%(+4.13)#594 |
| 77. | 07869 | 5.41% | 3.62%(+1.79)#77 | 1.31%(+4.11)#599 |
| 78. | 07601 | 5.39% | 3.62%(+1.77)#78 | 1.31%(+4.08)#607 |
| 79. | 08534 | 5.27% | 3.62%(+1.65)#79 | 1.31%(+3.97)#623 |
| 80. | 07632 | 5.12% | 3.62%(+1.50)#80 | 1.31%(+3.82)#659 |
| 81. | 08853 | 5.05% | 3.62%(+1.43)#81 | 1.31%(+3.74)#675 |
| 82. | 08869 | 5.04% | 3.62%(+1.41)#82 | 1.31%(+3.73)#679 |
| 83. | 08205 | 4.99% | 3.62%(+1.37)#83 | 1.31%(+3.69)#688 |
| 84. | 08876 | 4.98% | 3.62%(+1.35)#84 | 1.31%(+3.67)#690 |
| 85. | 08809 | 4.94% | 3.62%(+1.32)#85 | 1.31%(+3.63)#699 |
| 86. | 07662 | 4.80% | 3.62%(+1.18)#86 | 1.31%(+3.49)#725 |
| 87. | 08501 | 4.75% | 3.62%(+1.13)#87 | 1.31%(+3.44)#730 |
| 88. | 07074 | 4.75% | 3.62%(+1.13)#88 | 1.31%(+3.44)#731 |
| 89. | 07410 | 4.68% | 3.62%(+1.06)#89 | 1.31%(+3.37)#747 |
| 90. | 08836 | 4.62% | 3.62%(+1.00)#90 | 1.31%(+3.32)#765 |
| 91. | 07620 | 4.55% | 3.62%(+0.934)#91 | 1.31%(+3.25)#783 |
| 92. | 07974 | 4.52% | 3.62%(+0.895)#92 | 1.31%(+3.21)#795 |
| 93. | 07407 | 4.48% | 3.62%(+0.862)#93 | 1.31%(+3.17)#807 |
| 94. | 07057 | 4.43% | 3.62%(+0.806)#94 | 1.31%(+3.12)#816 |
| 95. | 07981 | 4.40% | 3.62%(+0.776)#95 | 1.31%(+3.09)#824 |
| 96. | 07921 | 4.38% | 3.62%(+0.763)#96 | 1.31%(+3.08)#829 |
| 97. | 07013 | 4.36% | 3.62%(+0.743)#97 | 1.31%(+3.06)#836 |
| 98. | 07733 | 4.34% | 3.62%(+0.723)#98 | 1.31%(+3.04)#840 |
| 99. | 07607 | 4.29% | 3.62%(+0.672)#99 | 1.31%(+2.98)#857 |
| 100. | 07970 | 4.28% | 3.62%(+0.659)#100 | 1.31%(+2.97)#862 |
Common Questions
What are the Top 10 Zip Codes with the Highest Percentage of Immigrants from South Central Asia in New Jersey?
Top 10 Zip Codes with the Highest Percentage of Immigrants from South Central Asia in New Jersey are:
What zip code has the Highest Percentage of Immigrants from South Central Asia in New Jersey?
07844 has the Highest Percentage of Immigrants from South Central Asia in New Jersey with 39.42%.
What is the Percentage of Immigrants from South Central Asia in the State of New Jersey?
Percentage of Immigrants from South Central Asia in New Jersey is 3.62%.
What is the Percentage of Immigrants from South Central Asia in the United States?
Percentage of Immigrants from South Central Asia in the United States is 1.31%.