Cities with the Highest Percentage of Greek Population in the United States
RELATED REPORTS & OPTIONS
Greek
United States
Compare Cities
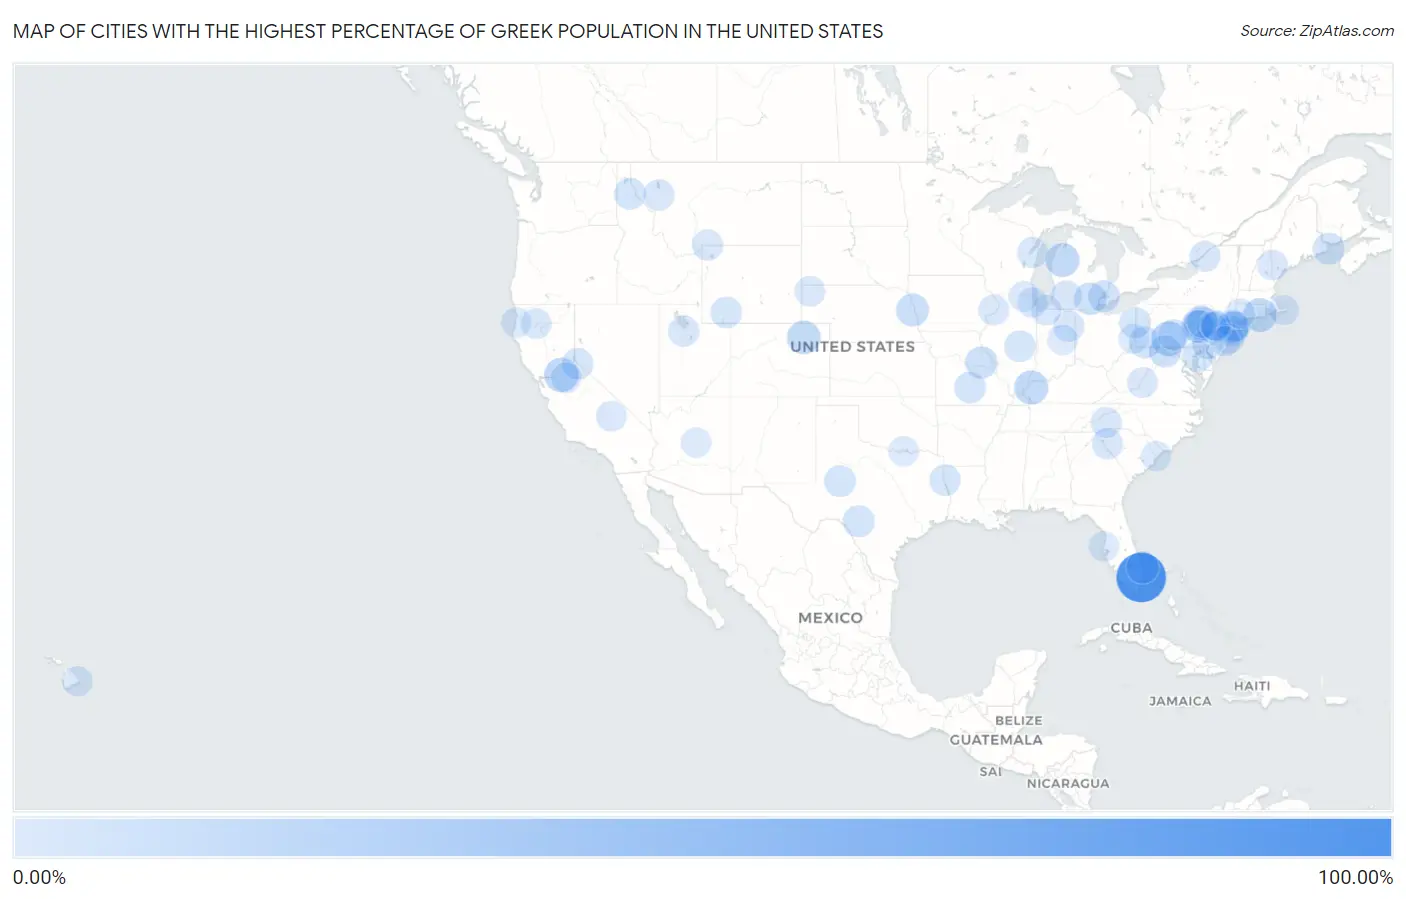
Map of Cities with the Highest Percentage of Greek Population in the United States
0.00%
100.00%
Cities with the Highest Percentage of Greek Population in the United States
| City | Greek | vs State | vs National | |
| 1. | Lazy Lake | 93.01% | 0.40%(+92.6)#1 | 0.37%(+92.6)#1 |
| 2. | North Blenheim | 41.77% | 0.71%(+41.1)#1 | 0.37%(+41.4)#2 |
| 3. | Defiance | 25.51% | 0.46%(+25.0)#1 | 0.37%(+25.1)#3 |
| 4. | Lindsay | 25.00% | 0.23%(+24.8)#1 | 0.37%(+24.6)#4 |
| 5. | Illinois | 24.32% | 0.68%(+23.6)#1 | 0.37%(+24.0)#5 |
| 6. | Connelsville | 23.86% | 0.21%(+23.7)#1 | 0.37%(+23.5)#6 |
| 7. | Wallace | 23.43% | 0.31%(+23.1)#1 | 0.37%(+23.1)#7 |
| 8. | Caberfae | 22.22% | 0.42%(+21.8)#1 | 0.37%(+21.9)#8 |
| 9. | Wheatcroft | 21.68% | 0.13%(+21.6)#1 | 0.37%(+21.3)#9 |
| 10. | Beech Mountain Lakes | 21.13% | 0.46%(+20.7)#2 | 0.37%(+20.8)#10 |
| 11. | Trail Side | 20.48% | 0.34%(+20.1)#1 | 0.37%(+20.1)#11 |
| 12. | Hopkinton | 20.43% | 0.66%(+19.8)#1 | 0.37%(+20.1)#12 |
| 13. | Broadview | 20.00% | 0.21%(+19.8)#1 | 0.37%(+19.6)#13 |
| 14. | Roachester | 18.95% | 0.43%(+18.5)#1 | 0.37%(+18.6)#14 |
| 15. | Park Crest | 17.15% | 0.46%(+16.7)#3 | 0.37%(+16.8)#15 |
| 16. | Herman | 16.94% | 0.20%(+16.7)#1 | 0.37%(+16.6)#16 |
| 17. | Lorenzo | 16.67% | 0.68%(+16.0)#2 | 0.37%(+16.3)#17 |
| 18. | Arthur | 16.16% | 0.30%(+15.9)#1 | 0.37%(+15.8)#18 |
| 19. | Juno Ridge | 15.98% | 0.40%(+15.6)#2 | 0.37%(+15.6)#19 |
| 20. | Brandonville | 15.53% | 0.46%(+15.1)#4 | 0.37%(+15.2)#20 |
| 21. | Downey | 14.81% | 0.18%(+14.6)#1 | 0.37%(+14.4)#21 |
| 22. | Barton Hills | 14.64% | 0.42%(+14.2)#2 | 0.37%(+14.3)#22 |
| 23. | High Hill | 14.35% | 0.21%(+14.1)#2 | 0.37%(+14.0)#23 |
| 24. | Plandome Manor | 13.68% | 0.71%(+13.0)#2 | 0.37%(+13.3)#24 |
| 25. | Paw Paw | 13.17% | 0.24%(+12.9)#1 | 0.37%(+12.8)#25 |
| 26. | Lubec | 12.79% | 0.46%(+12.3)#1 | 0.37%(+12.4)#26 |
| 27. | Camp Wood | 12.78% | 0.16%(+12.6)#1 | 0.37%(+12.4)#27 |
| 28. | Allison | 12.50% | 0.46%(+12.0)#5 | 0.37%(+12.1)#28 |
| 29. | Plandome Heights | 12.47% | 0.71%(+11.8)#3 | 0.37%(+12.1)#29 |
| 30. | La Tierra | 12.12% | 0.21%(+11.9)#2 | 0.37%(+11.7)#30 |
| 31. | Forsan | 11.84% | 0.16%(+11.7)#2 | 0.37%(+11.5)#31 |
| 32. | Wardner | 11.82% | 0.26%(+11.6)#1 | 0.37%(+11.4)#32 |
| 33. | Village Of Grosse Pointe Shores | 11.61% | 0.42%(+11.2)#3 | 0.37%(+11.2)#33 |
| 34. | Plato | 11.45% | 0.21%(+11.2)#3 | 0.37%(+11.1)#34 |
| 35. | Mesa Vista | 11.38% | 0.31%(+11.1)#2 | 0.37%(+11.0)#35 |
| 36. | Campbell | 11.19% | 0.43%(+10.8)#2 | 0.37%(+10.8)#36 |
| 37. | Purple Sage | 10.81% | 0.30%(+10.5)#1 | 0.37%(+10.4)#37 |
| 38. | Sportmans Shores | 10.76% | 0.12%(+10.6)#1 | 0.37%(+10.4)#38 |
| 39. | Laplace | 10.74% | 0.68%(+10.1)#3 | 0.37%(+10.4)#39 |
| 40. | Castella | 10.59% | 0.31%(+10.3)#3 | 0.37%(+10.2)#40 |
| 41. | Sweetwater | 10.48% | 0.64%(+9.84)#1 | 0.37%(+10.1)#41 |
| 42. | Hutchinson | 10.43% | 0.64%(+9.79)#2 | 0.37%(+10.1)#42 |
| 43. | Saddle River Borough | 10.17% | 0.64%(+9.53)#3 | 0.37%(+9.80)#43 |
| 44. | Tolchester | 10.09% | 0.49%(+9.59)#1 | 0.37%(+9.72)#44 |
| 45. | Greenville | 10.08% | 0.12%(+9.96)#2 | 0.37%(+9.71)#45 |
| 46. | Keachi | 10.00% | 0.13%(+9.87)#1 | 0.37%(+9.63)#46 |
| 47. | South Gull Lake | 9.84% | 0.42%(+9.42)#4 | 0.37%(+9.47)#47 |
| 48. | Cedar Crest | 9.72% | 0.46%(+9.27)#6 | 0.37%(+9.35)#48 |
| 49. | East Atlantic Beach | 9.68% | 0.71%(+8.96)#4 | 0.37%(+9.31)#49 |
| 50. | Erda | 9.67% | 0.39%(+9.28)#1 | 0.37%(+9.30)#50 |
| 51. | Grand Isle | 9.46% | 0.46%(+9.00)#2 | 0.37%(+9.09)#51 |
| 52. | Antreville | 9.44% | 0.30%(+9.14)#1 | 0.37%(+9.07)#52 |
| 53. | Kicking Horse | 9.43% | 0.23%(+9.21)#2 | 0.37%(+9.06)#53 |
| 54. | Quasset Lake | 9.43% | 0.80%(+8.63)#1 | 0.37%(+9.05)#54 |
| 55. | Jardine | 9.30% | 0.23%(+9.08)#3 | 0.37%(+8.93)#55 |
| 56. | Cheyney University | 9.21% | 0.46%(+8.75)#7 | 0.37%(+8.84)#56 |
| 57. | Uniondale | 8.97% | 0.30%(+8.67)#2 | 0.37%(+8.60)#57 |
| 58. | Argyle | 8.85% | 0.68%(+8.18)#4 | 0.37%(+8.48)#58 |
| 59. | Hammond | 8.55% | 0.71%(+7.84)#5 | 0.37%(+8.18)#59 |
| 60. | Hickory Hills | 8.55% | 0.46%(+8.09)#8 | 0.37%(+8.18)#60 |
| 61. | Wurtsboro Hills | 8.47% | 0.71%(+7.76)#6 | 0.37%(+8.10)#61 |
| 62. | Jones Valley | 8.46% | 0.31%(+8.15)#4 | 0.37%(+8.09)#62 |
| 63. | Blairsville | 8.46% | 0.30%(+8.16)#3 | 0.37%(+8.09)#63 |
| 64. | Dyckesville | 8.45% | 0.31%(+8.15)#1 | 0.37%(+8.08)#64 |
| 65. | Fredericksburg Cdp Crawford County | 8.31% | 0.46%(+7.85)#9 | 0.37%(+7.94)#65 |
| 66. | Bent Creek | 8.20% | 0.28%(+7.92)#1 | 0.37%(+7.83)#66 |
| 67. | South Seaville | 7.74% | 0.64%(+7.10)#4 | 0.37%(+7.37)#67 |
| 68. | Martell | 7.56% | 0.20%(+7.36)#2 | 0.37%(+7.19)#68 |
| 69. | Angels | 7.51% | 0.31%(+7.20)#5 | 0.37%(+7.14)#69 |
| 70. | Fryeburg | 7.39% | 0.46%(+6.92)#3 | 0.37%(+7.01)#70 |
| 71. | Crawford | 7.28% | 0.20%(+7.07)#3 | 0.37%(+6.90)#71 |
| 72. | Callaghan | 7.26% | 0.37%(+6.88)#1 | 0.37%(+6.88)#72 |
| 73. | Pottawattamie Park | 7.26% | 0.30%(+6.95)#4 | 0.37%(+6.88)#73 |
| 74. | Mckee | 7.23% | 0.46%(+6.77)#10 | 0.37%(+6.86)#74 |
| 75. | Seaside Heights Borough | 7.20% | 0.64%(+6.56)#5 | 0.37%(+6.83)#75 |
| 76. | Trinity Center | 7.20% | 0.31%(+6.89)#6 | 0.37%(+6.83)#76 |
| 77. | Homewood Canyon | 7.14% | 0.31%(+6.83)#7 | 0.37%(+6.77)#77 |
| 78. | Upper Brookville | 7.13% | 0.71%(+6.41)#7 | 0.37%(+6.76)#78 |
| 79. | Park View | 7.09% | 0.18%(+6.91)#2 | 0.37%(+6.72)#79 |
| 80. | Woodlawn Heights | 7.08% | 0.30%(+6.78)#5 | 0.37%(+6.71)#80 |
| 81. | Tarpon Springs | 7.05% | 0.40%(+6.65)#3 | 0.37%(+6.68)#81 |
| 82. | West Belmar | 6.98% | 0.64%(+6.34)#6 | 0.37%(+6.61)#82 |
| 83. | Northwest Harwich | 6.87% | 1.10%(+5.77)#1 | 0.37%(+6.50)#83 |
| 84. | Hope | 6.85% | 0.64%(+6.21)#7 | 0.37%(+6.48)#84 |
| 85. | Corinna | 6.83% | 0.46%(+6.37)#4 | 0.37%(+6.46)#85 |
| 86. | Botsford | 6.83% | 0.80%(+6.03)#2 | 0.37%(+6.46)#86 |
| 87. | Connecticut Farms | 6.76% | 0.64%(+6.12)#8 | 0.37%(+6.39)#87 |
| 88. | East | 6.73% | 0.80%(+5.93)#3 | 0.37%(+6.36)#88 |
| 89. | Murrells Inlet | 6.67% | 0.30%(+6.37)#2 | 0.37%(+6.30)#89 |
| 90. | Nanawale Estates | 6.66% | 0.20%(+6.46)#1 | 0.37%(+6.29)#90 |
| 91. | Greenwood | 6.64% | 0.68%(+5.96)#5 | 0.37%(+6.27)#91 |
| 92. | Westhaven Moonstone | 6.63% | 0.31%(+6.31)#8 | 0.37%(+6.25)#92 |
| 93. | Northfield | 6.61% | 0.68%(+5.93)#6 | 0.37%(+6.23)#93 |
| 94. | Cedar Glen West | 6.58% | 0.64%(+5.94)#9 | 0.37%(+6.21)#94 |
| 95. | Pine | 6.49% | 0.34%(+6.15)#1 | 0.37%(+6.12)#95 |
| 96. | Sherwood Shores | 6.48% | 0.16%(+6.32)#3 | 0.37%(+6.11)#96 |
| 97. | Beattystown | 6.41% | 0.64%(+5.77)#10 | 0.37%(+6.04)#97 |
| 98. | Weston | 6.40% | 0.80%(+5.60)#4 | 0.37%(+6.03)#98 |
| 99. | Woodbury Center | 6.37% | 0.80%(+5.57)#5 | 0.37%(+6.00)#99 |
| 100. | Yorkville | 6.36% | 0.43%(+5.93)#3 | 0.37%(+5.99)#100 |
Common Questions
What are the Top 10 Cities with the Highest Percentage of Greek Population in the United States?
Top 10 Cities with the Highest Percentage of Greek Population in the United States are:
#1
93.01%
#2
25.51%
#3
23.43%
#4
22.22%
#5
21.68%
#6
21.13%
#7
20.48%
#8
20.43%
#9
17.15%
#10
16.94%
What city has the Highest Percentage of Greek Population in the United States?
Lazy Lake has the Highest Percentage of Greek Population in the United States with 93.01%.
What is the Percentage of Greek Population in the United States?
Percentage of Greek Population in the United States is 0.37%.