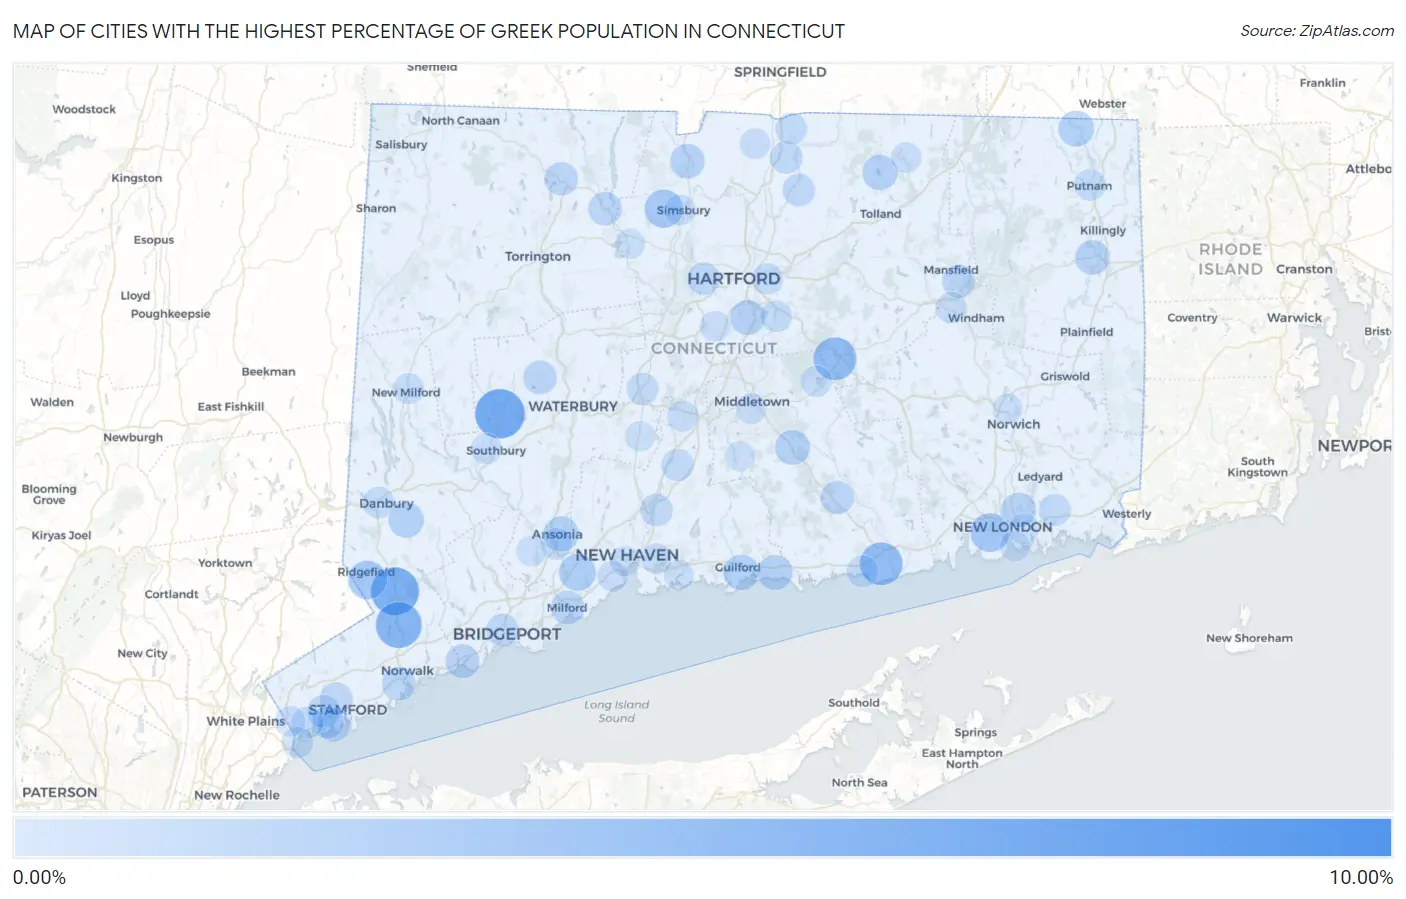
Cities with the Highest Percentage of Greek Population in Connecticut
RELATED REPORTS & OPTIONS
Greek
Connecticut
Compare Cities
Map of Cities with the Highest Percentage of Greek Population in Connecticut
0.00%
10.00%
Cities with the Highest Percentage of Greek Population in Connecticut
| City | Greek | vs State | vs National | |
| 1. | Quasset Lake | 9.43% | 0.80%(+8.63)#1 | 0.37%(+9.05)#54 |
| 2. | Botsford | 6.83% | 0.80%(+6.03)#2 | 0.37%(+6.46)#86 |
| 3. | East | 6.73% | 0.80%(+5.93)#3 | 0.37%(+6.36)#88 |
| 4. | Weston | 6.40% | 0.80%(+5.60)#4 | 0.37%(+6.03)#98 |
| 5. | Woodbury Center | 6.37% | 0.80%(+5.57)#5 | 0.37%(+6.00)#99 |
| 6. | Lakes West | 6.19% | 0.80%(+5.39)#6 | 0.37%(+5.81)#109 |
| 7. | Georgetown | 5.86% | 0.80%(+5.06)#7 | 0.37%(+5.49)#125 |
| 8. | West Mountain | 5.67% | 0.80%(+4.87)#8 | 0.37%(+5.30)#141 |
| 9. | Wilton Center | 5.24% | 0.80%(+4.44)#9 | 0.37%(+4.87)#162 |
| 10. | Old Saybrook Center | 4.26% | 0.80%(+3.46)#10 | 0.37%(+3.89)#238 |
| 11. | Terramuggus | 4.24% | 0.80%(+3.44)#11 | 0.37%(+3.87)#240 |
| 12. | Danielson Borough | 3.87% | 0.80%(+3.07)#12 | 0.37%(+3.50)#288 |
| 13. | Compo | 3.82% | 0.80%(+3.02)#13 | 0.37%(+3.45)#293 |
| 14. | Saugatuck | 3.73% | 0.80%(+2.93)#14 | 0.37%(+3.36)#305 |
| 15. | Waterford | 3.05% | 0.80%(+2.25)#15 | 0.37%(+2.68)#433 |
| 16. | Candlewood Knolls | 2.94% | 0.80%(+2.14)#16 | 0.37%(+2.57)#456 |
| 17. | Ridgefield | 2.91% | 0.80%(+2.11)#17 | 0.37%(+2.54)#465 |
| 18. | West Simsbury | 2.86% | 0.80%(+2.06)#18 | 0.37%(+2.49)#485 |
| 19. | Lake Bungee | 2.72% | 0.80%(+1.92)#19 | 0.37%(+2.35)#537 |
| 20. | Trumbull Center | 2.68% | 0.80%(+1.88)#20 | 0.37%(+2.31)#550 |
| 21. | Mill Plain | 2.50% | 0.80%(+1.70)#21 | 0.37%(+2.13)#612 |
| 22. | Orange | 2.38% | 0.80%(+1.58)#22 | 0.37%(+2.00)#658 |
| 23. | Quinebaug | 2.11% | 0.80%(+1.31)#23 | 0.37%(+1.74)#787 |
| 24. | Sandy Hook | 2.05% | 0.80%(+1.25)#24 | 0.37%(+1.68)#832 |
| 25. | Guilford Center | 2.01% | 0.80%(+1.21)#25 | 0.37%(+1.64)#865 |
| 26. | Northford | 2.00% | 0.80%(+1.20)#26 | 0.37%(+1.63)#871 |
| 27. | Bethel | 1.96% | 0.80%(+1.16)#27 | 0.37%(+1.58)#902 |
| 28. | Ansonia | 1.89% | 0.80%(+1.09)#28 | 0.37%(+1.52)#939 |
| 29. | Crystal Lake | 1.87% | 0.80%(+1.08)#29 | 0.37%(+1.50)#950 |
| 30. | Wethersfield | 1.85% | 0.80%(+1.05)#30 | 0.37%(+1.48)#972 |
| 31. | Higganum | 1.83% | 0.80%(+1.03)#31 | 0.37%(+1.46)#993 |
| 32. | Madison Center | 1.82% | 0.80%(+1.02)#32 | 0.37%(+1.45)#1,001 |
| 33. | Indian Field | 1.77% | 0.80%(+0.974)#33 | 0.37%(+1.40)#1,049 |
| 34. | East Brooklyn | 1.76% | 0.80%(+0.956)#34 | 0.37%(+1.38)#1,060 |
| 35. | Salmon Brook | 1.74% | 0.80%(+0.940)#35 | 0.37%(+1.37)#1,073 |
| 36. | Conning Towers Nautilus Park | 1.73% | 0.80%(+0.929)#36 | 0.37%(+1.36)#1,086 |
| 37. | Westport | 1.65% | 0.80%(+0.850)#37 | 0.37%(+1.28)#1,151 |
| 38. | Daniels Farm | 1.53% | 0.80%(+0.733)#38 | 0.37%(+1.16)#1,269 |
| 39. | Southport | 1.52% | 0.80%(+0.719)#39 | 0.37%(+1.15)#1,287 |
| 40. | New Hartford Center | 1.47% | 0.80%(+0.667)#40 | 0.37%(+1.09)#1,356 |
| 41. | Quinnipiac University | 1.46% | 0.80%(+0.662)#41 | 0.37%(+1.09)#1,361 |
| 42. | Watertown | 1.46% | 0.80%(+0.661)#42 | 0.37%(+1.09)#1,362 |
| 43. | Milford City Balance | 1.46% | 0.80%(+0.657)#43 | 0.37%(+1.09)#1,366 |
| 44. | Norwalk | 1.43% | 0.80%(+0.633)#44 | 0.37%(+1.06)#1,394 |
| 45. | Chester Center | 1.39% | 0.80%(+0.588)#45 | 0.37%(+1.02)#1,452 |
| 46. | Winsted | 1.37% | 0.80%(+0.567)#46 | 0.37%(+0.995)#1,486 |
| 47. | Newtown Borough | 1.33% | 0.80%(+0.528)#47 | 0.37%(+0.956)#1,538 |
| 48. | Staples | 1.32% | 0.80%(+0.520)#48 | 0.37%(+0.948)#1,550 |
| 49. | Old Greenwich | 1.32% | 0.80%(+0.518)#49 | 0.37%(+0.946)#1,552 |
| 50. | Sacred Heart University | 1.26% | 0.80%(+0.461)#50 | 0.37%(+0.889)#1,639 |
| 51. | Mansfield Center | 1.25% | 0.80%(+0.449)#51 | 0.37%(+0.877)#1,665 |
| 52. | Stamford | 1.21% | 0.80%(+0.414)#52 | 0.37%(+0.842)#1,722 |
| 53. | Bridgeport | 1.18% | 0.80%(+0.378)#53 | 0.37%(+0.806)#1,774 |
| 54. | Cos Cob | 1.17% | 0.80%(+0.374)#54 | 0.37%(+0.802)#1,781 |
| 55. | West Hartford | 1.16% | 0.80%(+0.357)#55 | 0.37%(+0.785)#1,811 |
| 56. | North Haven | 1.15% | 0.80%(+0.350)#56 | 0.37%(+0.778)#1,827 |
| 57. | Bantam Borough | 1.15% | 0.80%(+0.348)#57 | 0.37%(+0.776)#1,831 |
| 58. | Broad Brook | 1.12% | 0.80%(+0.324)#58 | 0.37%(+0.752)#1,870 |
| 59. | Southwood Acres | 1.12% | 0.80%(+0.323)#59 | 0.37%(+0.751)#1,873 |
| 60. | Wallingford Center | 1.05% | 0.80%(+0.246)#60 | 0.37%(+0.674)#2,017 |
| 61. | Inglenook | 1.02% | 0.80%(+0.217)#61 | 0.37%(+0.645)#2,093 |
| 62. | Old Mystic | 1.00% | 0.80%(+0.205)#62 | 0.37%(+0.633)#2,120 |
| 63. | Plantsville | 0.96% | 0.80%(+0.160)#63 | 0.37%(+0.588)#2,220 |
| 64. | Riverside | 0.95% | 0.80%(+0.146)#64 | 0.37%(+0.574)#2,256 |
| 65. | Greenwich | 0.94% | 0.80%(+0.140)#65 | 0.37%(+0.568)#2,267 |
| 66. | Noroton | 0.87% | 0.80%(+0.075)#66 | 0.37%(+0.503)#2,462 |
| 67. | Woodmont Borough | 0.86% | 0.80%(+0.065)#67 | 0.37%(+0.493)#2,493 |
| 68. | Derby | 0.86% | 0.80%(+0.057)#68 | 0.37%(+0.485)#2,511 |
| 69. | Danbury | 0.85% | 0.80%(+0.054)#69 | 0.37%(+0.482)#2,522 |
| 70. | Glastonbury Center | 0.82% | 0.80%(+0.017)#70 | 0.37%(+0.445)#2,648 |
| 71. | Saybrook Manor | 0.81% | 0.80%(+0.013)#71 | 0.37%(+0.441)#2,662 |
| 72. | Sherwood Manor | 0.80% | 0.80%(+0.003)#72 | 0.37%(+0.431)#2,712 |
| 73. | East Hartford | 0.79% | 0.80%(-0.009)#73 | 0.37%(+0.420)#2,756 |
| 74. | Putnam | 0.79% | 0.80%(-0.009)#74 | 0.37%(+0.419)#2,758 |
| 75. | Byram | 0.78% | 0.80%(-0.024)#75 | 0.37%(+0.404)#2,816 |
| 76. | Stratford Downtown | 0.72% | 0.80%(-0.081)#76 | 0.37%(+0.347)#3,016 |
| 77. | Oronoque | 0.69% | 0.80%(-0.111)#77 | 0.37%(+0.317)#3,130 |
| 78. | Meriden | 0.68% | 0.80%(-0.116)#78 | 0.37%(+0.312)#3,154 |
| 79. | Willimantic | 0.68% | 0.80%(-0.118)#79 | 0.37%(+0.310)#3,165 |
| 80. | Lake Pocotopaug | 0.67% | 0.80%(-0.127)#80 | 0.37%(+0.301)#3,185 |
| 81. | New Milford | 0.65% | 0.80%(-0.151)#81 | 0.37%(+0.277)#3,273 |
| 82. | Simsbury Center | 0.62% | 0.80%(-0.178)#82 | 0.37%(+0.250)#3,387 |
| 83. | Heritage Village | 0.61% | 0.80%(-0.188)#83 | 0.37%(+0.241)#3,439 |
| 84. | West Haven | 0.57% | 0.80%(-0.227)#84 | 0.37%(+0.201)#3,650 |
| 85. | Stafford Springs | 0.53% | 0.80%(-0.268)#85 | 0.37%(+0.160)#3,893 |
| 86. | Middletown | 0.53% | 0.80%(-0.268)#86 | 0.37%(+0.160)#3,894 |
| 87. | Suffield Depot | 0.53% | 0.80%(-0.269)#87 | 0.37%(+0.159)#3,902 |
| 88. | Glenville | 0.51% | 0.80%(-0.285)#88 | 0.37%(+0.143)#3,991 |
| 89. | East Haven | 0.50% | 0.80%(-0.297)#89 | 0.37%(+0.131)#4,069 |
| 90. | Newington | 0.49% | 0.80%(-0.314)#90 | 0.37%(+0.114)#4,174 |
| 91. | Long Hill | 0.44% | 0.80%(-0.357)#91 | 0.37%(+0.071)#4,496 |
| 92. | Groton | 0.44% | 0.80%(-0.362)#92 | 0.37%(+0.066)#4,530 |
| 93. | Shelton | 0.44% | 0.80%(-0.363)#93 | 0.37%(+0.065)#4,538 |
| 94. | Durham | 0.43% | 0.80%(-0.367)#94 | 0.37%(+0.061)#4,567 |
| 95. | Greens Farms | 0.43% | 0.80%(-0.373)#95 | 0.37%(+0.055)#4,624 |
| 96. | New Haven | 0.42% | 0.80%(-0.378)#96 | 0.37%(+0.050)#4,660 |
| 97. | Norwich | 0.41% | 0.80%(-0.388)#97 | 0.37%(+0.040)#4,743 |
| 98. | Cheshire Village | 0.41% | 0.80%(-0.391)#98 | 0.37%(+0.037)#4,770 |
| 99. | Collinsville | 0.40% | 0.80%(-0.400)#99 | 0.37%(+0.028)#4,839 |
| 100. | Branford Center | 0.39% | 0.80%(-0.413)#100 | 0.37%(+0.015)#4,943 |
Common Questions
What are the Top 10 Cities with the Highest Percentage of Greek Population in Connecticut?
Top 10 Cities with the Highest Percentage of Greek Population in Connecticut are:
#1
6.37%
#2
5.86%
#3
5.24%
#4
4.26%
#5
4.24%
#6
3.05%
#7
2.91%
#8
2.86%
#9
2.38%
#10
2.11%
What city has the Highest Percentage of Greek Population in Connecticut?
Woodbury Center has the Highest Percentage of Greek Population in Connecticut with 6.37%.
What is the Percentage of Greek Population in the State of Connecticut?
Percentage of Greek Population in Connecticut is 0.80%.
What is the Percentage of Greek Population in the United States?
Percentage of Greek Population in the United States is 0.37%.