Cities with the Highest Percentage of Greek Population in Delaware

RELATED REPORTS & OPTIONS

Greek
Population
Families and Households
Female Fertility
Female Fertility (Unmarried)
Race (Community Size)
Race (Percentage)
Ancestry (Community Size)
AfghanAfricanAlaska NativeAlaskan AthabascanAlbanianAleutAlsatianAmericanApacheArabArapahoArgentineanArmenianAssyrian / Chaldean / SyriacAustralianAustrianBahamianBangladeshiBarbadianBasqueBelgianBelizeanBermudanBhutaneseBlackfeetBolivianBrazilianBritishBritish West IndianBulgarianBurmeseCajunCambodianCanadianCape VerdeanCarpatho RusynCelticCentral AmericanCentral American IndianCherokeeCheyenneChickasawChileanChineseChippewaChoctawColombianColvilleComancheCosta RicanCreeCreekCroatianCrowCubanCypriotCzechCzechoslovakianDanishDelawareDominicanDutchDutch West IndianEastern EuropeanEcuadorianEgyptianEnglishEstonianEthiopianEuropeanFijianFilipinoFinnishFrenchFrench American IndianFrench CanadianGermanGerman RussianGhanaianGreekGuamanian / ChamorroGuatemalanGuyaneseHaitianHmongHonduranHopiHoumaHungarianIcelanderIndian (Asian)IndonesianInupiatIranianIraqiIrishIroquoisIsraeliItalianJamaicanJapaneseJordanianKenyanKiowaKoreanLaotianLatvianLebaneseLiberianLithuanianLumbeeLuxembourgerMacedonianMalaysianMalteseMarshalleseMenomineeMexicanMexican American IndianMongolianMoroccanNative HawaiianNavajoNepaleseNew ZealanderNicaraguanNigerianNorthern EuropeanNorwegianOkinawanOsageOttawaPaiutePakistaniPalestinianPanamanianParaguayanPennsylvania GermanPeruvianPimaPolishPortuguesePotawatomiPuebloPuerto RicanPuget Sound SalishRomanianRussianSalvadoranSamoanScandinavianScotch-IrishScottishSeminoleSenegaleseSerbianShoshoneSierra LeoneanSiouxSlavicSlovakSloveneSomaliSouth AfricanSouth AmericanSouth American IndianSoviet UnionSpaniardSpanishSpanish AmericanSpanish American IndianSri LankanSubsaharan AfricanSudaneseSwedishSwissSyrianTaiwaneseThaiTlingit-HaidaTohono O'OdhamTonganTrinidadian and TobagonianTsimshianTurkishU.S. Virgin IslanderUgandanUkrainianUruguayanUteVenezuelanVietnameseWelshWest IndianYakamaYaquiYugoslavianYumanYup'ikZimbabwean
Ancestry (Percentage)
AfghanAfricanAlaska NativeAlaskan AthabascanAlbanianAleutAlsatianAmericanApacheArabArapahoArgentineanArmenianAssyrian / Chaldean / SyriacAustralianAustrianBahamianBangladeshiBarbadianBasqueBelgianBelizeanBermudanBhutaneseBlackfeetBolivianBrazilianBritishBritish West IndianBulgarianBurmeseCajunCambodianCanadianCape VerdeanCarpatho RusynCelticCentral AmericanCentral American IndianCherokeeCheyenneChickasawChileanChineseChippewaChoctawColombianColvilleComancheCosta RicanCreeCreekCroatianCrowCubanCypriotCzechCzechoslovakianDanishDelawareDominicanDutchDutch West IndianEastern EuropeanEcuadorianEgyptianEnglishEstonianEthiopianEuropeanFijianFilipinoFinnishFrenchFrench American IndianFrench CanadianGermanGerman RussianGhanaianGreekGuamanian / ChamorroGuatemalanGuyaneseHaitianHmongHonduranHopiHoumaHungarianIcelanderIndian (Asian)IndonesianInupiatIranianIraqiIrishIroquoisIsraeliItalianJamaicanJapaneseJordanianKenyanKiowaKoreanLaotianLatvianLebaneseLiberianLithuanianLumbeeLuxembourgerMacedonianMalaysianMalteseMarshalleseMenomineeMexicanMexican American IndianMongolianMoroccanNative HawaiianNavajoNepaleseNew ZealanderNicaraguanNigerianNorthern EuropeanNorwegianOkinawanOsageOttawaPaiutePakistaniPalestinianPanamanianParaguayanPennsylvania GermanPeruvianPimaPolishPortuguesePotawatomiPuebloPuerto RicanPuget Sound SalishRomanianRussianSalvadoranSamoanScandinavianScotch-IrishScottishSeminoleSenegaleseSerbianShoshoneSierra LeoneanSiouxSlavicSlovakSloveneSomaliSouth AfricanSouth AmericanSouth American IndianSoviet UnionSpaniardSpanishSpanish AmericanSpanish American IndianSri LankanSubsaharan AfricanSudaneseSwedishSwissSyrianTaiwaneseThaiTlingit-HaidaTohono O'OdhamTonganTrinidadian and TobagonianTsimshianTurkishU.S. Virgin IslanderUgandanUkrainianUruguayanUteVenezuelanVietnameseWelshWest IndianYakamaYaquiYugoslavianYumanYup'ikZimbabwean
Immigrant Origin (Total)
AfghanistanAfricaAlbaniaArgentinaArmeniaAsiaAustraliaAustriaAzoresBahamasBangladeshBarbadosBelarusBelgiumBelizeBoliviaBosnia and HerzegovinaBrazilBulgariaBurma / MyanmarCabo VerdeCambodiaCameroonCanadaCaribbeanCentral AmericaChileChinaColombiaCongoCosta RicaCroatiaCubaCzechoslovakiaDenmarkDominicaDominican RepublicEastern AfricaEastern AsiaEastern EuropeEcuadorEgyptEl SalvadorEnglandEritreaEthiopiaEuropeFijiFranceGermanyGhanaGreeceGrenadaGuatemalaGuyanaHaitiHondurasHong KongHungaryIndiaIndonesiaIranIraqIrelandIsraelItalyJamaicaJapanJordanKazakhstanKenyaKoreaKuwaitLaosLatin AmericaLatviaLebanonLiberiaLithuaniaMalaysiaMexicoMicronesiaMiddle AfricaMoldovaMoroccoNepalNetherlandsNicaraguaNigeriaNorth MacedoniaNorthern AfricaNorthern EuropeNorwayOceaniaPakistanPanamaPeruPhilippinesPolandPortugalRomaniaRussiaSaudi ArabiaScotlandSenegalSerbiaSierra LeoneSingaporeSomaliaSouth AfricaSouth AmericaSouth Central AsiaSouth Eastern AsiaSouthern EuropeSpainSri LankaSt. Vincent and the GrenadinesSudanSwedenSwitzerlandSyriaTaiwanThailandTrinidad and TobagoTurkeyUgandaUkraineUruguayUzbekistanVenezuelaVietnamWest IndiesWestern AfricaWestern AsiaWestern EuropeYemenZaireZimbabwe
Immigrant Origin (Percentage)
AfghanistanAfricaAlbaniaArgentinaArmeniaAsiaAustraliaAustriaAzoresBahamasBangladeshBarbadosBelarusBelgiumBelizeBoliviaBosnia and HerzegovinaBrazilBulgariaBurma / MyanmarCabo VerdeCambodiaCameroonCanadaCaribbeanCentral AmericaChileChinaColombiaCongoCosta RicaCroatiaCubaCzechoslovakiaDenmarkDominicaDominican RepublicEastern AfricaEastern AsiaEastern EuropeEcuadorEgyptEl SalvadorEnglandEritreaEthiopiaEuropeFijiFranceGermanyGhanaGreeceGrenadaGuatemalaGuyanaHaitiHondurasHong KongHungaryIndiaIndonesiaIranIraqIrelandIsraelItalyJamaicaJapanJordanKazakhstanKenyaKoreaKuwaitLaosLatin AmericaLatviaLebanonLiberiaLithuaniaMalaysiaMexicoMicronesiaMiddle AfricaMoldovaMoroccoNepalNetherlandsNicaraguaNigeriaNorth MacedoniaNorthern AfricaNorthern EuropeNorwayOceaniaPakistanPanamaPeruPhilippinesPolandPortugalRomaniaRussiaSaudi ArabiaScotlandSenegalSerbiaSierra LeoneSingaporeSomaliaSouth AfricaSouth AmericaSouth Central AsiaSouth Eastern AsiaSouthern EuropeSpainSri LankaSt. Vincent and the GrenadinesSudanSwedenSwitzerlandSyriaTaiwanThailandTrinidad and TobagoTurkeyUgandaUkraineUruguayUzbekistanVenezuelaVietnamWest IndiesWestern AfricaWestern AsiaWestern EuropeYemenZaireZimbabwe
Income
Income (Families)
Income (Households)
Poverty
Poverty (Families)
Unemployment
Employment Occupations
Employment Industries
Employer Class
Commute Time
Commute Means
School Enrollment
Education by Degree Field
Occupancy
Finances
Physical Characteristics
Delaware
Compare Cities
Comparison Subject

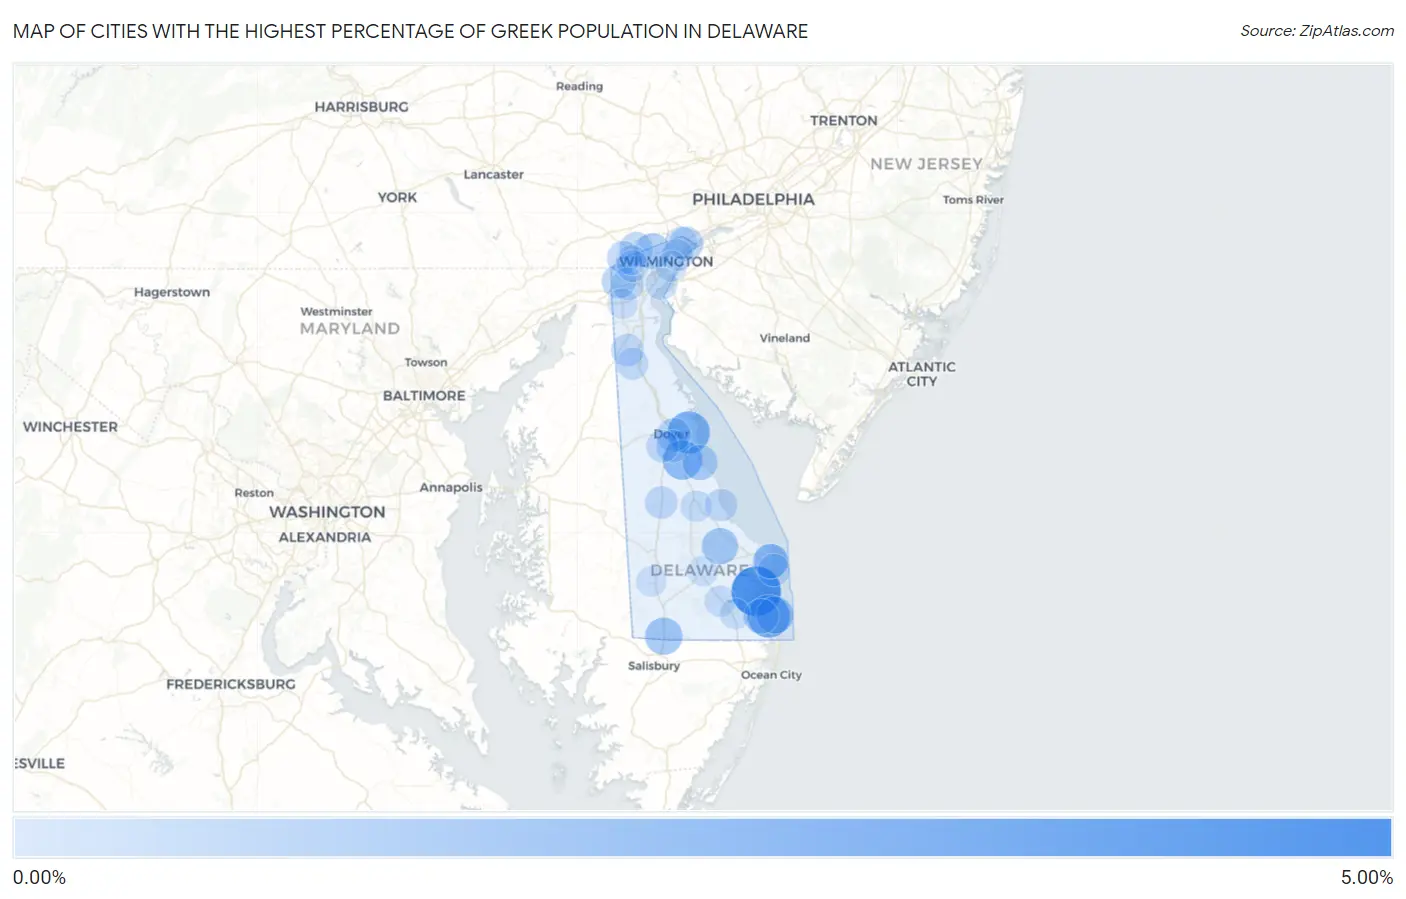
Map of Cities with the Highest Percentage of Greek Population in Delaware

0.00%
5.00%
Cities with the Highest Percentage of Greek Population in Delaware Map

Cities with the Highest Percentage of Greek Population in Delaware

City Greek vs State vs National
1.Long Neck4.79%0.47%(+4.33)#10.37%(+4.42)#202
2.Ocean View3.12%0.47%(+2.65)#20.37%(+2.75)#411
3.Little Creek2.94%0.47%(+2.47)#30.37%(+2.57)#454
4.Magnolia2.28%0.47%(+1.81)#40.37%(+1.91)#708
5.Delmar1.71%0.47%(+1.24)#50.37%(+1.34)#1,102
6.Bethany Beach1.69%0.47%(+1.22)#60.37%(+1.32)#1,116
7.Milton1.49%0.47%(+1.02)#70.37%(+1.12)#1,315
8.Greenville1.38%0.47%(+0.913)#80.37%(+1.01)#1,465
9.Bowers1.19%0.47%(+0.722)#90.37%(+0.819)#1,751
10.Millville1.12%0.47%(+0.653)#100.37%(+0.749)#1,877
11.Rehoboth Beach1.11%0.47%(+0.637)#110.37%(+0.734)#1,911
12.Henlopen Acres1.04%0.47%(+0.568)#120.37%(+0.665)#2,041
13.Newark0.92%0.47%(+0.448)#130.37%(+0.545)#2,339
14.Dover0.89%0.47%(+0.419)#140.37%(+0.516)#2,431
15.Claymont0.87%0.47%(+0.405)#150.37%(+0.502)#2,466
16.Hockessin0.84%0.47%(+0.375)#160.37%(+0.471)#2,552
17.North Star0.70%0.47%(+0.237)#170.37%(+0.333)#3,062
18.Middletown0.61%0.47%(+0.143)#180.37%(+0.239)#3,445
19.Harrington0.61%0.47%(+0.142)#190.37%(+0.238)#3,448
20.Highland Acres0.59%0.47%(+0.123)#200.37%(+0.219)#3,556
21.Dewey Beach0.56%0.47%(+0.089)#210.37%(+0.186)#3,739
22.Brookside0.54%0.47%(+0.076)#220.37%(+0.173)#3,818
23.Slaughter Beach0.51%0.47%(+0.041)#230.37%(+0.137)#4,018
24.Wyoming0.48%0.47%(+0.008)#240.37%(+0.105)#4,243
25.Ardentown0.45%0.47%(-0.020)#250.37%(+0.077)#4,448
26.Townsend0.40%0.47%(-0.065)#260.37%(+0.032)#4,808
27.Pike Creek Valley0.40%0.47%(-0.067)#270.37%(+0.030)#4,826
28.New Castle0.40%0.47%(-0.070)#280.37%(+0.027)#4,850
29.Milford0.31%0.47%(-0.161)#290.37%(-0.064)#5,626
30.Millsboro0.29%0.47%(-0.177)#300.37%(-0.081)#5,799
31.Bellefonte0.26%0.47%(-0.206)#310.37%(-0.109)#6,121
32.Wilmington0.23%0.47%(-0.236)#320.37%(-0.139)#6,471
33.Dagsboro0.15%0.47%(-0.319)#330.37%(-0.222)#7,526
34.Seaford0.099%0.47%(-0.369)#340.37%(-0.272)#8,111
35.Glasgow0.097%0.47%(-0.371)#350.37%(-0.274)#8,135
36.Georgetown0.028%0.47%(-0.441)#360.37%(-0.344)#8,772
37.Pike Creek0.014%0.47%(-0.454)#370.37%(-0.357)#8,835

Common Questions

What are the Top 10 Cities with the Highest Percentage of Greek Population in Delaware?
Top 10 Cities with the Highest Percentage of Greek Population in Delaware are:
#1
4.79%
#2
3.12%
#3
2.94%
#4
2.28%
#5
1.71%
#6
1.69%
#7
1.49%
#8
1.38%
#9
1.19%
#10
1.12%
What city has the Highest Percentage of Greek Population in Delaware?
Long Neck has the Highest Percentage of Greek Population in Delaware with 4.79%.
What is the Percentage of Greek Population in the State of Delaware?
Percentage of Greek Population in Delaware is 0.47%.
What is the Percentage of Greek Population in the United States?
Percentage of Greek Population in the United States is 0.37%.