Cities with the Highest Percentage of Greek Population in Indiana
RELATED REPORTS & OPTIONS
Greek
Indiana
Compare Cities
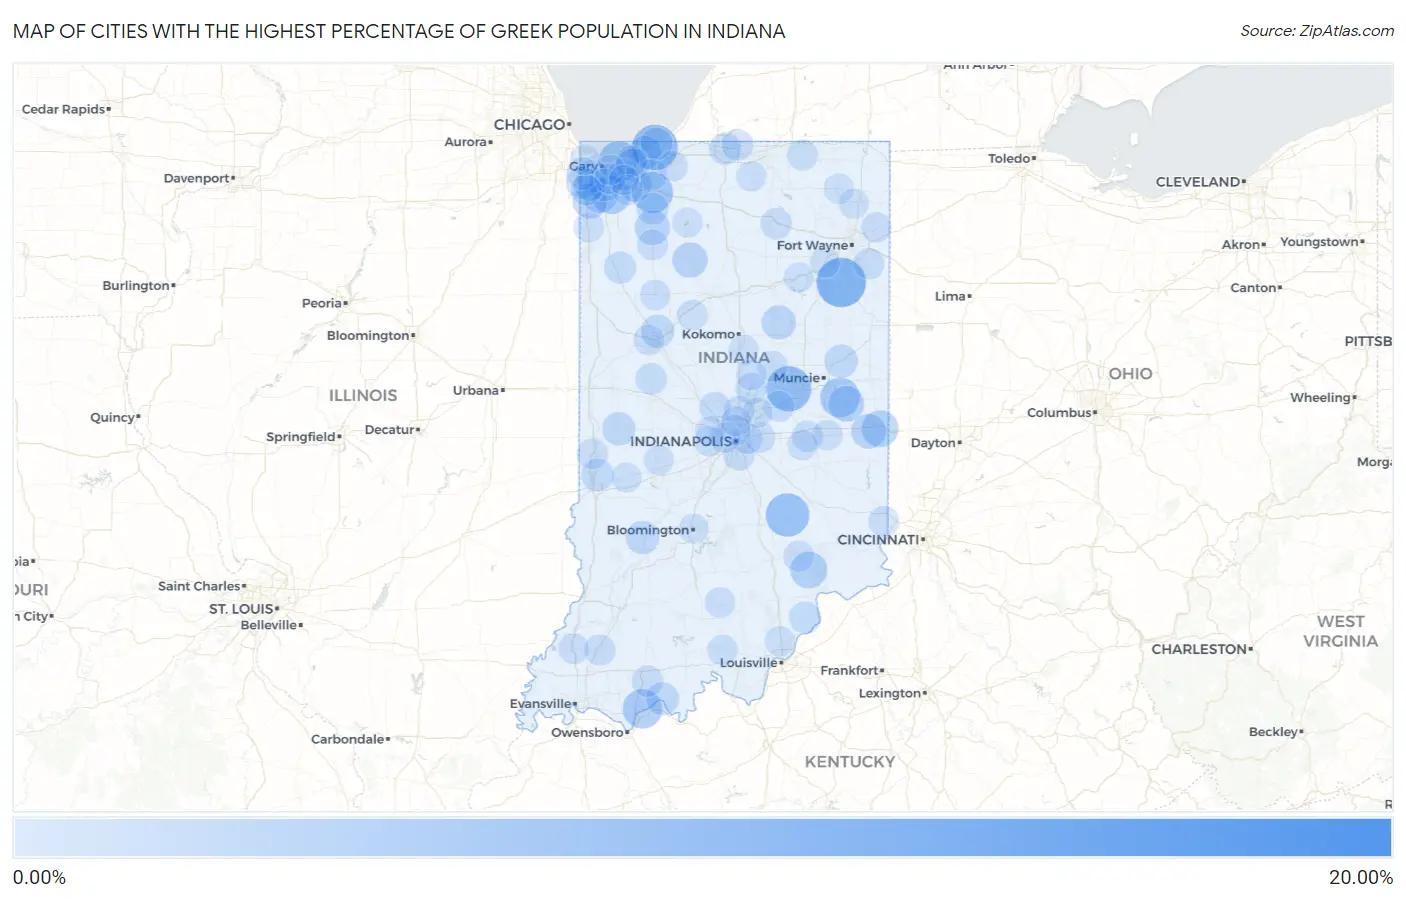
Map of Cities with the Highest Percentage of Greek Population in Indiana
0.00%
20.00%
Cities with the Highest Percentage of Greek Population in Indiana
| City | Greek | vs State | vs National | |
| 1. | Arthur | 16.16% | 0.30%(+15.9)#1 | 0.37%(+15.8)#18 |
| 2. | Uniondale | 8.97% | 0.30%(+8.67)#2 | 0.37%(+8.60)#57 |
| 3. | Blairsville | 8.46% | 0.30%(+8.16)#3 | 0.37%(+8.09)#63 |
| 4. | Pottawattamie Park | 7.26% | 0.30%(+6.95)#4 | 0.37%(+6.88)#73 |
| 5. | Woodlawn Heights | 7.08% | 0.30%(+6.78)#5 | 0.37%(+6.71)#80 |
| 6. | Hartsville | 6.23% | 0.30%(+5.93)#6 | 0.37%(+5.86)#106 |
| 7. | Petersville | 5.85% | 0.30%(+5.55)#7 | 0.37%(+5.48)#127 |
| 8. | Wanatah | 5.28% | 0.30%(+4.98)#8 | 0.37%(+4.91)#160 |
| 9. | Ogden Dunes | 4.84% | 0.30%(+4.54)#9 | 0.37%(+4.47)#198 |
| 10. | Adams Lake | 4.81% | 0.30%(+4.51)#10 | 0.37%(+4.44)#200 |
| 11. | Blountsville | 4.59% | 0.30%(+4.29)#11 | 0.37%(+4.22)#211 |
| 12. | Grandview | 4.50% | 0.30%(+4.19)#12 | 0.37%(+4.12)#221 |
| 13. | Winfield | 4.02% | 0.30%(+3.72)#13 | 0.37%(+3.65)#270 |
| 14. | Dupont | 3.36% | 0.30%(+3.06)#14 | 0.37%(+2.99)#371 |
| 15. | Spring Grove | 3.28% | 0.30%(+2.98)#15 | 0.37%(+2.91)#388 |
| 16. | Crown Point | 2.88% | 0.30%(+2.58)#16 | 0.37%(+2.51)#477 |
| 17. | Losantville | 2.88% | 0.30%(+2.58)#17 | 0.37%(+2.51)#478 |
| 18. | Star City | 2.65% | 0.30%(+2.35)#18 | 0.37%(+2.28)#556 |
| 19. | San Pierre | 2.52% | 0.30%(+2.22)#19 | 0.37%(+2.15)#604 |
| 20. | Centerville | 2.50% | 0.30%(+2.20)#20 | 0.37%(+2.13)#611 |
| 21. | Cedar Lake | 2.39% | 0.30%(+2.09)#21 | 0.37%(+2.02)#652 |
| 22. | Sweetser | 2.17% | 0.30%(+1.87)#22 | 0.37%(+1.80)#753 |
| 23. | Town Of Pines | 2.00% | 0.30%(+1.70)#23 | 0.37%(+1.63)#876 |
| 24. | Valparaiso | 1.90% | 0.30%(+1.60)#24 | 0.37%(+1.53)#933 |
| 25. | Albany | 1.86% | 0.30%(+1.56)#25 | 0.37%(+1.49)#969 |
| 26. | Worthington | 1.81% | 0.30%(+1.51)#26 | 0.37%(+1.44)#1,009 |
| 27. | Marshall | 1.81% | 0.30%(+1.51)#27 | 0.37%(+1.44)#1,010 |
| 28. | Battle Ground | 1.78% | 0.30%(+1.48)#28 | 0.37%(+1.41)#1,037 |
| 29. | Troy | 1.73% | 0.30%(+1.43)#29 | 0.37%(+1.36)#1,088 |
| 30. | Chesterton | 1.63% | 0.30%(+1.33)#30 | 0.37%(+1.26)#1,163 |
| 31. | Merrillville | 1.51% | 0.30%(+1.21)#31 | 0.37%(+1.14)#1,296 |
| 32. | Long Beach | 1.44% | 0.30%(+1.13)#32 | 0.37%(+1.06)#1,390 |
| 33. | Griffith | 1.42% | 0.30%(+1.11)#33 | 0.37%(+1.04)#1,417 |
| 34. | North Terre Haute | 1.39% | 0.30%(+1.09)#34 | 0.37%(+1.02)#1,445 |
| 35. | Dyer | 1.38% | 0.30%(+1.08)#35 | 0.37%(+1.01)#1,462 |
| 36. | New Washington | 1.30% | 0.30%(+0.994)#36 | 0.37%(+0.924)#1,580 |
| 37. | Rensselaer | 1.28% | 0.30%(+0.974)#37 | 0.37%(+0.904)#1,620 |
| 38. | Schererville | 1.27% | 0.30%(+0.973)#38 | 0.37%(+0.903)#1,625 |
| 39. | Munster | 1.26% | 0.30%(+0.958)#39 | 0.37%(+0.888)#1,645 |
| 40. | Roseland | 1.26% | 0.30%(+0.958)#40 | 0.37%(+0.888)#1,647 |
| 41. | La Crosse | 1.23% | 0.30%(+0.931)#41 | 0.37%(+0.861)#1,691 |
| 42. | Linden | 1.07% | 0.30%(+0.764)#42 | 0.37%(+0.694)#1,987 |
| 43. | Westville | 1.04% | 0.30%(+0.735)#43 | 0.37%(+0.665)#2,040 |
| 44. | Cicero | 1.03% | 0.30%(+0.725)#44 | 0.37%(+0.655)#2,063 |
| 45. | South Haven | 1.01% | 0.30%(+0.707)#45 | 0.37%(+0.637)#2,105 |
| 46. | Santa Claus | 0.98% | 0.30%(+0.681)#46 | 0.37%(+0.612)#2,170 |
| 47. | Granger | 0.95% | 0.30%(+0.651)#47 | 0.37%(+0.581)#2,240 |
| 48. | Homecroft | 0.95% | 0.30%(+0.648)#48 | 0.37%(+0.578)#2,246 |
| 49. | Zionsville | 0.95% | 0.30%(+0.645)#49 | 0.37%(+0.575)#2,253 |
| 50. | Porter | 0.92% | 0.30%(+0.621)#50 | 0.37%(+0.551)#2,324 |
| 51. | Hoagland | 0.91% | 0.30%(+0.609)#51 | 0.37%(+0.540)#2,361 |
| 52. | Winona Lake | 0.91% | 0.30%(+0.604)#52 | 0.37%(+0.534)#2,372 |
| 53. | St John | 0.84% | 0.30%(+0.538)#53 | 0.37%(+0.468)#2,559 |
| 54. | Knightstown | 0.83% | 0.30%(+0.526)#54 | 0.37%(+0.456)#2,604 |
| 55. | Oakland City | 0.83% | 0.30%(+0.524)#55 | 0.37%(+0.455)#2,613 |
| 56. | Pendleton | 0.81% | 0.30%(+0.508)#56 | 0.37%(+0.439)#2,669 |
| 57. | Vernon | 0.81% | 0.30%(+0.505)#57 | 0.37%(+0.435)#2,693 |
| 58. | Fairview Park | 0.79% | 0.30%(+0.488)#58 | 0.37%(+0.418)#2,765 |
| 59. | Medaryville | 0.77% | 0.30%(+0.467)#59 | 0.37%(+0.398)#2,841 |
| 60. | Elwood | 0.73% | 0.30%(+0.430)#60 | 0.37%(+0.360)#2,961 |
| 61. | Hobart | 0.71% | 0.30%(+0.405)#61 | 0.37%(+0.335)#3,057 |
| 62. | Shipshewana | 0.69% | 0.30%(+0.386)#62 | 0.37%(+0.316)#3,139 |
| 63. | Cumberland | 0.68% | 0.30%(+0.383)#63 | 0.37%(+0.313)#3,151 |
| 64. | Warren Park | 0.68% | 0.30%(+0.376)#64 | 0.37%(+0.306)#3,173 |
| 65. | Carmel | 0.66% | 0.30%(+0.358)#65 | 0.37%(+0.288)#3,221 |
| 66. | Reynolds | 0.65% | 0.30%(+0.350)#66 | 0.37%(+0.280)#3,252 |
| 67. | Rocky Ripple | 0.65% | 0.30%(+0.350)#67 | 0.37%(+0.280)#3,253 |
| 68. | Saltillo | 0.65% | 0.30%(+0.348)#68 | 0.37%(+0.278)#3,270 |
| 69. | Atlanta | 0.65% | 0.30%(+0.345)#69 | 0.37%(+0.275)#3,277 |
| 70. | Camden | 0.64% | 0.30%(+0.336)#70 | 0.37%(+0.266)#3,308 |
| 71. | West Lafayette | 0.61% | 0.30%(+0.307)#71 | 0.37%(+0.237)#3,456 |
| 72. | Princeton | 0.60% | 0.30%(+0.297)#72 | 0.37%(+0.228)#3,508 |
| 73. | Bright | 0.60% | 0.30%(+0.296)#73 | 0.37%(+0.226)#3,517 |
| 74. | Milltown | 0.57% | 0.30%(+0.264)#74 | 0.37%(+0.195)#3,686 |
| 75. | Speedway | 0.56% | 0.30%(+0.263)#75 | 0.37%(+0.193)#3,700 |
| 76. | Harlan | 0.56% | 0.30%(+0.256)#76 | 0.37%(+0.186)#3,736 |
| 77. | La Porte | 0.55% | 0.30%(+0.252)#77 | 0.37%(+0.182)#3,763 |
| 78. | Lewisville | 0.54% | 0.30%(+0.243)#78 | 0.37%(+0.173)#3,812 |
| 79. | Roanoke | 0.54% | 0.30%(+0.238)#79 | 0.37%(+0.168)#3,840 |
| 80. | Schneider | 0.53% | 0.30%(+0.233)#80 | 0.37%(+0.163)#3,870 |
| 81. | Carthage | 0.53% | 0.30%(+0.229)#81 | 0.37%(+0.159)#3,901 |
| 82. | Aberdeen | 0.51% | 0.30%(+0.211)#82 | 0.37%(+0.141)#4,000 |
| 83. | Hammond | 0.51% | 0.30%(+0.203)#83 | 0.37%(+0.134)#4,046 |
| 84. | Avon | 0.50% | 0.30%(+0.203)#84 | 0.37%(+0.133)#4,052 |
| 85. | Sellersburg | 0.49% | 0.30%(+0.191)#85 | 0.37%(+0.121)#4,138 |
| 86. | Bass Lake | 0.49% | 0.30%(+0.189)#86 | 0.37%(+0.120)#4,146 |
| 87. | Fishers | 0.49% | 0.30%(+0.189)#87 | 0.37%(+0.119)#4,148 |
| 88. | Wakarusa | 0.48% | 0.30%(+0.181)#88 | 0.37%(+0.111)#4,201 |
| 89. | Lake Station | 0.47% | 0.30%(+0.170)#89 | 0.37%(+0.100)#4,272 |
| 90. | Kendallville | 0.47% | 0.30%(+0.170)#90 | 0.37%(+0.100)#4,275 |
| 91. | Greencastle | 0.46% | 0.30%(+0.154)#91 | 0.37%(+0.085)#4,382 |
| 92. | Brownsburg | 0.46% | 0.30%(+0.154)#92 | 0.37%(+0.085)#4,383 |
| 93. | Garrett | 0.45% | 0.30%(+0.149)#93 | 0.37%(+0.079)#4,426 |
| 94. | Andrews | 0.45% | 0.30%(+0.147)#94 | 0.37%(+0.078)#4,439 |
| 95. | Williams Creek | 0.44% | 0.30%(+0.143)#95 | 0.37%(+0.073)#4,485 |
| 96. | Floyds Knobs | 0.44% | 0.30%(+0.135)#96 | 0.37%(+0.066)#4,535 |
| 97. | Salt Creek Commons | 0.43% | 0.30%(+0.130)#97 | 0.37%(+0.060)#4,577 |
| 98. | Sharpsville | 0.43% | 0.30%(+0.125)#98 | 0.37%(+0.055)#4,618 |
| 99. | Brazil | 0.42% | 0.30%(+0.117)#99 | 0.37%(+0.047)#4,683 |
| 100. | Bloomington | 0.42% | 0.30%(+0.115)#100 | 0.37%(+0.045)#4,703 |
Common Questions
What are the Top 10 Cities with the Highest Percentage of Greek Population in Indiana?
Top 10 Cities with the Highest Percentage of Greek Population in Indiana are:
#1
8.97%
#2
7.26%
#3
7.08%
#4
6.23%
#5
5.28%
#6
4.84%
#7
4.59%
#8
4.50%
#9
4.02%
#10
3.36%
What city has the Highest Percentage of Greek Population in Indiana?
Uniondale has the Highest Percentage of Greek Population in Indiana with 8.97%.
What is the Percentage of Greek Population in the State of Indiana?
Percentage of Greek Population in Indiana is 0.30%.
What is the Percentage of Greek Population in the United States?
Percentage of Greek Population in the United States is 0.37%.